Tag Archives: abstract

Best Of AAST 2021: Trauma Transfers Discharged From The ED

Aren’t these embarrassing? A referring center sends you a patient with the idea that they will be evaluated and admitted to your hospital. But it doesn’t work out that way. The patient is seen, possibly by a surgical specialist, bandaged up, and then sent home. Probably to one that is quite a few miles away. Not only is this a nuisance for the patient and an embarrassment for the sending center, it may use resources at the trauma center that are already tight.

Transfer patients who are seen and discharged are another form of “ultimate overtriage.” In this case, the incorrect triage takes place at the outside hospital.  The trauma group in Oklahoma City reviewed their experience with these patients over a two year period. They looked exclusively at patients who were transferred in to a Level I center and then discharged.

Here are the factoids:

  • A total of 2,350 patients were transferred in, and 27% were transferred home directly from the trauma bay (!)
  • The three most common culprits by injury pattern were face (51%), hand (31%), isolated ortho injury (9%)
  • A third of these patients required a bedside procedure, including laceration repair (53%), eye exam (24%), splinting (18%), and joint reduction (5%)
  • Ten facilities accounted for 40% of the transfers

The authors concluded that the typical injuries prompting transfer are predictable. It may be possible to reduce the number of transfers by deploying telemedicine systems to push evaluations out to the referring hospitals.

Bottom line: This is quite interesting. Anyone who works in a Level I or II center is aware of this phenomenon. This abstract went a step further and quantified the specific issues involved. This center ended up discharging over 300 patients per year after transfer in. This is a tremendous drain on resources by patients who did not truly have the need for them.

The authors speculate that telemedicine evaluation may help reduce some of those transfers. This seems like an easy solution. However, it also poses a lot of issues in terms of who will actually staff the calls and how will they be compensated for their time.

There are a number of important take-aways from this abstract:

  1. Know your referring hospitals. In this study, there were 10 hospitals that generated an oversize number of referrals. Those are the targets / low hanging fruit. Identify them!
  2. Understand what their needs are. Are they frequently having issues with simple ortho injuries? Eye exams? This is what they need!
  3. Provide education and training to make them more comfortable. This allows you to target those hospitals with exactly the material they need and hopefully make them more self-sufficient.

This allows the higher level centers to reserve phone and/or telemedicine consultation for only the most ambiguous cases. It’s a better use of telehealth resources that may be needed, typically at night and on weekends.

Here are my questions for the presenter and authors:

  • Would the common issues that were transferred and discharged be amenable to education and training at the referring centers to decrease the transfer volume?
  • How have you begun to address this issue at your center?

Reference: TRAUMA TRANSFERS DISCHARGED FROM THE EMERGENCY DEPARTMENT – IS THERE A ROLE FOR TELEMEDICINE. AAST 2021, Oral abstract #63.

Best Of AAST 2021: Chest Tube Based On Pneumothorax Size

How big is too big? That has been the question for a long time as it applies to pneumothorax and chest tubes. For many, it is a math problem that takes into account the appearance on chest x-ray, the physiology of the patient, and their ability to tolerate the pneumothorax based on any pre-existing medical conditions.

The group at Froedtert in Milwaukee has been trying to make this decision a bit more objective. They introduced the concept of CT based size measurement using a 35mm threshold at this very meeting three years ago. Read my review here. My criticisms at the time centered around the need to get a CT scan for diagnosis and their subjective definition of a failure requiring chest tube insertion. The abstract never did make it to publication.

The authors are back now with a follow-on study. This time, they made a rule that any pneumothorax less than 35mm from the chest wall would be observed without tube placement. The performed a retrospective review of their experience and divided it into two time periods: 2015-2016, before the new rule, and 2018-2019, after the new rule. They excluded any chest tubes inserted before the scan was performed, those that included a sizable hemothorax, and patients placed on a ventilator or who died.

Here are the factoids:

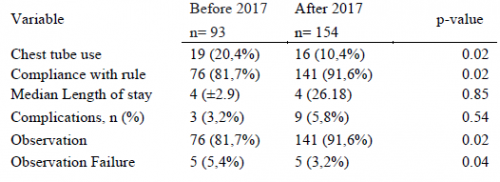
  • There were 93 patients in the early period and 154 in the later period
  • Chest tube use significantly declined from 20% to 10% between the two periods
  • Compliance with the rule significantly increased from 82% to 92%
  • There was no difference in length of stay, complications, or death
  • Observation failure was marginally less in the later period, and statistical significance depends on what method you use to calculate it
  • Patients in the later group were 2x more likely to be observed (by regression analysis)

The authors concluded that the 35mm rule resulted in a two-fold increase in observation and decreased the number of unnecessary CT scans.

Bottom line: I still have a few issues with this series of abstracts. First, decision to insert a chest tube requires a CT scan in a patient with a pneumothorax. This seems like extra radiation for patients who may not otherwise fit any of the usual blunt imaging criteria. And, like their 2018 abstract, there is no objective criteria for failure requiring tube insertion. So the number of insertions can potentially be quite subjective based on the whims of the individual surgeon.

What this abstract really shows is that compliance with the new rule increased, and there were no obvious complications from its use. The other numbers (chest tube insertions, observation failure) are just too subjective to learn much from.

Here are my questions for the presenter and authors:

  • Why was there such a large increase in the number of subjects for two identical-length time periods? Both were two years long, yet there were two-thirds more patients in the later period. Did your trauma center volumes go up that much? If not, could this represent some sort of selection bias that might change your numbers?
  • You concluded that your new rule decreased the number of “unnecessary” CT scans? How so? It looks like you are using more of them!
  • Do you routinely get a chest CT on all your patients with pneumothorax? Seems like a lot of radiation just to decide whether or not to put a tube in.
  • How do you manage a pneumothorax found on chest x-ray? Must they get a CT? Or are you willing to watch them and follow with serial x-rays?
  • How do you decide to take out the chest tube? Hopefully not another scan!

There should be some very interesting discussion of this abstract!

Reference: THE 35-MM RULE TO GUIDE PNEUMOTHORAX MANAGEMENT: INCREASES APPROPRIATE OBSERVATION AND DECREASES UNNECESARY CHEST TUBES. AAST 2021, Oral abstract #56.

Best Of AAST 2021: Individual Surgeon Outcomes In Trauma Laparotomy

Trauma programs use a number of quality indicators and PI filters to evaluate both individual and system performance. The emergent trauma laparotomy (ETL) is the index case for any trauma surgeon and is performed on a regular basis. However, this is one procedure where individual surgeon outcome is rarely benchmarked.

The trauma group in Birmingham AL performed a retrospective review of 242 ETLs performed at their hospital over a 14 month period. They then excluded patients who underwent resuscitative thoracotomy prior to the laparotomy. Rates of use of damage control and mortality at various time points were studied.

Here are the factoids:

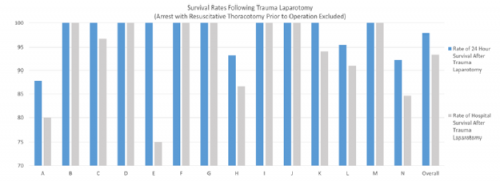
The chart shows the survival rates after ETL at 24 hours (blue) and to discharge (gray) for 14 individual surgeons.

  • Six patients died intraoperatively and damage control laparotomy was performed in one third.
  • Mortality was 4% at 24 hours and 7% overall
  • ISS and time in ED were similar, but operative time varied substantially (40-469 minutes)
  • There were significant differences in individual surgeon mortality and use of damage control

The authors concluded that there were significant differences in outcomes by surgeon, and that more granular quality metrics should be developed for quality improvement.

Bottom line: I worry that this work is a superficial treatment of surgeon performance. The use of gross outcomes like death and use of damage control is not very helpful, in my opinion. There are so, so many other variables involved in who is likely to survive or the decision-making to consider the use of damage control. I am concerned that a simplistic retrospective review without most of those variables will lead to false conclusions.

It may be that there is a lot more information here that just couldn’t fit on the abstract page. In that case, the presentation should clear it all up.  But I am doubtful.

We have already reached a point in medicine where hospitals with better outcomes for patients with certain conditions can be identified. These centers should be selected preferentially to treat stroke or pancreatic cancer, or whatever there benchmark-proven expertise is. It really is time for this to begin to trickle down to individual providers. A specific surgeon should be encouraged to do what they are demonstrated to be really good at, and other surgeons should handle the things the first surgeon is only average at.

But I don’t think this study can provide the level of benchmarking to suggest changes to a surgeon’s practice or the selection of a specific surgeon for a procedure. A lot more work is needed to identify the pertinent variables needed to develop legitimate benchmarks.

Here are my questions for the presenter and authors:

  • Show us the details of all of the variables you analyzed (ISS, NISS, time in ED, etc) and the breakdown by surgeon.
  • Are there any other variables that influence the outcome that you wish you had collected?
  • There were an average of 17 cases per surgeon in your study. Is it possible to show statistical significance for anything given these small numbers?

The devil is in the details, and I hope these come out during the presentation!

Reference: IT’S TIME TO LOOK IN THE MIRROR: INDIVIDUAL SURGEON OUTCOMES AFTER EMERGENT TRUMA LAPAROTOMY. AAST 2021, oral abstract #38.

Best Of AAST 2021: Validating The “Brain Injury Guidelines” (BIG)

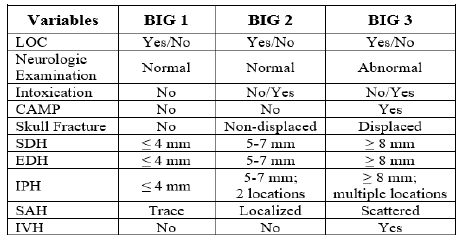
The Brain Injury  Guidelines (BIG) were developed to allow trauma programs to stratify head injuries in such a way as to better utilize resources such as hospital beds, CT scanning, and neurosurgical consultation. Injuries are stratified into three BIG categories, and management is based on it. Here is the stratification algorithm:

And here is the management algorithm based on the stratification above:

The AAST BIG Multi-Institutional Group set about validating this system to ensure that it was accurate and safe. They identified adult patients from nine high level trauma centers that had a positive initial head CT scan. They looked at the the need for neurosurgical intervention, change in neuro exam, progression on repeat head CT, any visits to the ED after discharge, and readmission for the injury within 30 days.

Here are the factoids:

  • About 2,000 patients were included in the study, with BIG1 = 15%, BIG2 = 15%, and BIG3 = 70% of patients
  • BIG1: no patients worsened, 1% had progression on CT, none required neurosurgical intervention, no readmits or ED visits
  • BIG2: 1% worsened clinically, 7% had progression on CT, none required neurosurgical intervention, no readmits or ED visits
  • All patients who required neurosurgical intervention were BIG3 (20% of patients)

The authors concluded that using the BIG criteria, CT scan use and neurosurgical consultation would have been decreased by 29%.

Bottom line: This is an exciting abstract! BIG has been around for awhile, and some centers have already started using it for planning the management of their TBI patients. This study provides some validation that the system works and keeps patients safe while being respectful of resource utilization. 

My only criticism is that the number of patients in the BIG1 and BIG2 categories is low (about 600 combined). Thus, our experience in these groups remains somewhat limited. However, the study is very promising, and more centers should consider adopting BIG to help them refine their management of TBI patients.

Reference: VALIDATING THE BRAIN INJURY GUIDELINES (BIG): RESULTS OF AN AAST PROSPECTIVE MULTI-INSTITUTIONAL TRIAL. AAST 2021, Oral abstract #25.

Best Of AAST: Delayed Treatment Of Blunt Carotid And Vertebral Injury

I recently published a series on blunt carotid and vertebral artery injury (BCVI). Today, I’ll review an AAST abstract that details the results of a multicenter study on the timing of medical treatment of this condition. This typically takes the form of anti-platelet agents, usually aspirin.

The trial collected prospective, observational data from 16 trauma centers. Patients had to receive medical therapy at some time after their injury or they were excluded. The stroke consequences of early vs late medical therapy were evaluated, where late was defined at > 24 hours.

Here are the factoids:

  • There were 636 BCVI included in the study
  • Median time to first medical therapy was 11 hours in the early group and 62 hours in the late group
  • ISS was higher in the delayed group (26 vs 22); although this was “statistically significant”, it is probably not a clinically significant difference
  • There was no increase in stroke rate with later administration of medical treatment

Bottom line: This is a very interesting study. We always worry about missing BCVI (see my previous post here), and now we know a little more about what happens if we do. The authors suggest that the stroke rate does not go up if medical management is delayed, say for some other potential bleeding issue.

This is a reasonably large data set, but the key thing to consider is the time frame observed. The median delay to medical management was only about 2.5 days. Were there any strokes involved in the patients with much longer delays? That is the real question. And were there any strokes that occurred despite early/immediate medical management?

The descriptive statistics and simple analyses presented do not provide all of the information we need. A stoke is a very significant adverse event for the patient. Statistical means are fine, but information on the specific patients who suffered one is necessary to truly understand this issue.

Here is my question for the presenter and authors:

  • Please break down the details on all patients who suffered a stroke. It will be very interesting to see if there were any in the early group and if there was a trend toward stroke in the very late tail data.

Reference: DOES TREATMENT DELAY FOR BLUNT CEREBROVASCULAR INJURY AFFECT STROKE RATE?: AN EAST MULTICENTERTRIAL. AAST 2021, Oral abstract #23.