Tag Archives: transfusion

Best Of EAST #13: Whole Blood And Hypocalcemia

Hypocalcemia has long been known to exacerbate coagulopathy. Calcium is involved at several points in the coagulation cascade. Once serum levels drop below about 0.25 mmol/L (normal value 1.2-1.4 mmol/L) thrombin generation and clot formation cease. Although levels this low are probably rare, anything between this low and the normal level can significantly lower clot strength.

Trauma patients are more likely to have bleeding issues than most, and trauma professionals do their best to avoid coagulopathy. Unfortunately, the products we use to replace shed blood are preserved with citrate, which binds calcium. Given in even modest to large quantities, transfusion itself can lead to hypocalcemia.

Most blood transfused in the US has been broken down into separate components (packed cells (PRBC), plasma, platelets) and the effect on calcium levels is well known. The trauma group at Oregon Health Sciences University studied the impact on calcium of whole blood transfusions.

They performed a retrospective review of data collected prospectively over a 2.5 year period on patients receiving whole blood. This included the number of transfusions, ionized calcium levels, and calcium replacements administered. Patients were divided into two groups, those who received whole blood only and those who were given whole blood and component therapy. Outcomes evaluated were ionized calcium levels, hypocalcemia correction, and death.

Here are the factoids:

  • During the study period, 335 patients received whole blood, but only 67% met inclusion criteria
  • About half (103) received a median of 2 units of whole blood (only!)
  • The authors do not state how many component units the whole blood plus component therapy group received
  • There was no difference in calcium levels based on average ISS in the two groups, although ISS does not differentiate injuries that bleed very well
  • Hypocalcemia occurred in only 4% of whole blood patients vs 15% of whole blood + components, which was significant
  • Hypocalcemia within the first hour was significantly associated with death in the first 24 hours and 30 days, although the standard deviation or SEM of this value was large
  • Whole blood only patients received less calcium replacement, and failure to correct was associated with 24 hour mortality
  • Median time to death in patients that “failed to correct” was 7.5 hours after admission

The authors conclude that hypocalcemia rarely occurs in whole blood only resuscitation, and that adding components increases its incidence and overall mortality. They state that aggressive calcium supplementation should be prioritized if component therapy is used.

Bottom line: There’s a lot to “unpack” here! Packed red cells are preserved with 3g of citrate per unit, whereas whole blood units contain only half that amount (1.66g to be exact). One would expect that one unit of packed cells would have twice the anticoagulant effect as a unit of whole blood.

This study is a blended model, where every patient got some whole blood, but some got components as well. Why? Is there a blood refrigerator in the ED stocked with whole blood, and when it is exhausted there is a switch to components? This model makes it more difficult to tease out the impact of the components given. Perhaps it could be done by matching patients with a given amount of whole blood. That is, comparing patients with 3 whole blood with those who received 3 whole blood + 2 PRBC.

There was no room in the abstract to explain why one third of patients were excluded from the study. This needs to be provided to ensure that the remaining two thirds are representative and can legitimately be analyzed. 

The number of units of whole blood per patient was low, with a median of two units given. Is it surprising that these patients did better than ones who received many more? Remember, from a citrate anticoagulant perspective, hanging two units of whole blood is the same as giving just one unit of PRBC.

This abstract raises a lot of questions, and the most important ones deal with how it was designed and the exact numbers of product given. Only then can we be confident that the rest of the associations described are significant.

Here are my questions for the authors and presenter:

  • Why did you choose the whole blood vs whole blood + components for your study? Wouldn’t it have been cleaner to do whole blood only vs components only? Perhaps all of your patients get whole blood? It seems like this might make the results more difficult to tease out.
  • How is whole blood made available for your trauma patients, and did this have an impact on your study? Do you have a limited number beyond which component therapy is used?
  • What were the inclusion criteria? These were not stated in the abstract, but a third of patients were excluded from the study based on them.
  • Could excluding a third of patients have skewed your results, and how?
  • How many component units were given along with the whole blood in the combination group? This was not provided in the abstract and will have a major impact on outcomes if the median total product numbers are significantly higher.
  • What does “failed to correct” mean? Were the patients not responding to large amounts of administered calcium, or were they not receiving large amounts of it?

I am very interested in the fine details in this abstract and will be listening intently to the presentation!

Reference: WHOLE BLOOD RESUSCITATION IN TRAUMA REGULATES CALCIUM HOMEOSTASIS AND MINIMIZES SEVERE HYPOCALCEMIA SEEN WITH COMPONENT THERAPY. EAST 35th ASA, oral abstract #6.

Best Of EAST #2: Pay Attention To Platelet Ratios In Your MTP!

More MTP stuff! Every trauma center has a massive transfusion protocol, and current literature encourages them to try to achieve an “optimal” transfusion ratio. The literature has converged on a red cell to plasma ratio of somewhere between 1:1 and 2:1. Less has been written about platelet ratios, and trauma centers often don’t pay as much attention to this ratio when reviewing MTPs.

But is it important? The trauma group at the Massachusetts General Hospital examined the impact of platelet ratios on mortality in patients undergoing MTP. This was another TQIP data analysis, performed over a nine year period.

The authors defined massive transfusion as ten or more units of PRBC in the first 24 hours, or any number of units of red cells, plasma, or platelets given within the first four hours. They also defined “balanced” as a ratio of RBC to FFP and RBC to platelets <2. Multivariate regression analysis was performed to gauge the impact of ratios and achievement of a balanced resuscitation on 24-hour mortality.

Here are the factoids:

  • A total of 7,520 patients in the dataset underwent MTP
  • Nearly 83% achieved RBC to FFP balance, but only 6% had RBC to platelet balance (!)
  • Patients with both balanced FFP and platelets had the lowest mortality at 24 hours
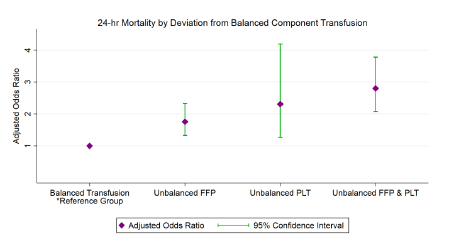
  • Mortality increased by 2x with unbalanced plasma, a little more than 2x with unbalanced platelets, and 3x if both were out of balance (see figure)

The authors concluded that the platelet component of the MTP was frequently out of balance, and that it is associated with mortality to a greater degree than with unbalanced plasma.

Bottom line: This paper confirms my observations that trauma centers pay a lot more attention to the red cell to plasma ratio and don’t get as excited when the platelets are out of line. Part of this is probably due to confusion over how to count platelet packs. Typically they are delivered in packs called “pheresis” or “apheresis.” Each is the equivalent of about 6 units of platelets (check with your blood bank for more exact numbers). This means that a ratio of 6 RBC to 5 plasma to 1 platelets would be considered balanced. But a ratio of 28:28:2 would not.

According to this abstract, the use of sufficient platelets is important. This makes sense. However, the exact mechanism cannot be determined from this type of study. It could be a direct effect of not having enough platelets to form good clot. Or it could be something completely outside the clotting mechanism, just an association with something in the care processes that occurs as these patients undergo resuscitation. 

The why doesn’t matter so much, though. This abstract presents compelling data that suggests that we really need to pay attention to the platelet ratios given during the MTP. They should be analyzed just as closely as plasma ratios during PI review, and changes to the MTP process implemented to normalize this important ratio.

Here are my questions for the authors and presenter:

  • There is a statement in the methods section that is not clear. “only patients with steady RBC/PLT and RBC/FFP ratios between 4-and 24-hr were analyzed.” What is your definition of “steady?”
  • Did you see any mortality patterns in the data you analyzed that might suggest why lower platelet volumes were more deadly?

This was a nicely done abstract, and I look forward to the live presentation and the finished manuscript!

Reference: DON’T FORGET THE PLATELETS: BALANCED TRANSFUSION AND THE INDEPENDENT IMPACT OF RBC/PLT RATIO ON MORTALITY IN MASSIVELY TRANSFUSED TRAUMA PATIENTS. EAST 25th ASA, Oral abstract #1.

Best Of AAST 2021: Are We Getting Better At Balanced Resuscitation?

The way we resuscitate major trauma patients has been changing over the past decade. Even the 10th edition of the ATLS course has recognized that so-called balanced resuscitation is important. This concept limits the use of crystalloid and relies more heavily on blood component administration in ratios that more closely approximate whole blood.  Balanced resuscitation typically translates as the use of less than two liters of crystalloid, and blood product transfusion ratios of 1:1 to 2:1 (PRBC to plasma).

We have also recognized the critical importance of rapid control of major hemorrhage, which is best accomplished in an operating room.  The group at the University of Arizona massaged the TQIP database to see if these changes are having a significant impact on our patients.

They looked at five years worth of data, specifically reviewing information on adult patients with both transfusion and laparotomy occurring within four hours of arrival. The authors performed regression analyses to identify trends over the study period.

Here are the factoids:

  • Nearly 10,000 patients met study criteria with a mean age of 44 and ISS 34
  • Patients were in shock, with mean SBP 78 and median number of transfusions of 9 PRBC and 6 plasma
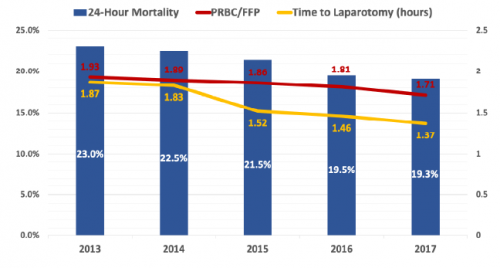
  • Time to laparotomy decreased from 1.87 hours to 1.37 hours over the five year period
  • 24-hour mortality decreased from 23% to 19% during the study
  • Blood product ratio decreased from 1.93:1 to 1.73:1
  • The authors state that the blood product ratio was independently associated with 24 hour mortality (odds ratio of 1.09) and in-hospital mortality (1.10) (??)

The authors conclude that resuscitation is becoming more balanced and time to surgery shorter, with a significant improvement in mortality.

Bottom line: Well, this is an interested study of associations. It uses a large database, which of course limits some of the information available. There are obvious trends toward faster time to OR (by 30 minutes) and a 4% improvement in survival. But the transfusion ratio really looks to be about the same. 

Let’s do the math, assuming that an average of 10 units of PRBC were given. A ratio of 1.93 would mean that 5.2 units of plasma were give (1425 cc, assuming 275 cc per unit). The ratio of 1.73 noted in 2017 would then be 5.8 units, or 1590 cc. This is an increase in FFP transfusion of 165 cc.

The authors stated that the improvement in transfusion ratios was statistically associated with the improvement in survival. I think this is one of those situations where there is a big difference between statistical significance and clinical significance. Do you really think that giving just 165 additional ccs of plasma could have that much overall effect on survival?

My suspicion is that there is a true association between the more rapid time to OR (and presumably surgical control) and survival. It’s just that the numbers were not clean enough to meet statistical rigor.

This is an interesting abstract, and shows that we are slowly getting better at controlling bleeding. But I think the most important takeaway is that we are not as good at balanced resuscitation as we think we are. We seem to be hovering at the 2:1 ratio, and only very slowly moving toward 1:1.

Questions for the authors / presenter:

  • Were you able to see a correlation between time to OR and survival?
  • Please comment on the association between transfusion ratios and survival, especially given the very small change over time.
  • Please clarify the in-hospital mortality and 24-hour mortality variables. In-hospital mortality suddenly pops up at the end of the results, but was never mentioned before.

Reference: AFTER 9,000 LAPAROTOMIES FOR BLUNT TRAUMA, RESUSCITATION IS BECOMING MORE BALANCED AND TIME TO INTERVENTION SHORTER: HOW LOW CAN WE GO? AAST 2021, Oral abstract #3.

Rapid Infusers: How Fast Can They Go?

The rapid infusion pump is a mainstay of high volume trauma resuscitation. According to the manufacturers, these devices can now deliver fluids at up to 1000 ml/minute. Or can they?

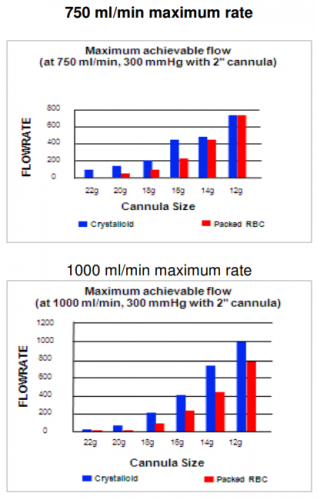
Here is a chart from the manufacturer of the Belmont rapid infuser. This shows the (theoretical) flow rates achievable for each of their two devices (max flow rate of 750 ml/min and 1000 ml/min models). The charts show the maximum flow rates for crystalloid or blood for various sizes of IV catheters that are 2″ long.

Notice two things:

  • The flow rate decreases exponentially as the size of the IV catheter decreases
  • The difference in flow rate between blood and crystalloid diminishes as the catheter size increases

These observations can be explained by something I’m sure you haven’t thought about since high school physics: Pouiseulle’s Equation. Of course you remember, right?

The equation states that the flow of a fluid (F) is proportional to the fourth power of the radius of the catheter and the pressure gradient across the two ends of it (delta P), and inversely proportional to the viscosity of the fluid (greek letter eta) and the length of the catheter (L).

What does this mean in practical terms?

  • The pressure gradient is fixed at about 300 mm Hg (the pressure bag or pump) so you can essentially ignore this factor
  • The viscosity (measured in centipoise) is based on the fluid begin given. Crystalloid (water) has a viscosity of 1. Whole blood has a viscosity of about 2.7, and packed cells are about 10. This means that our typical infusion of PRBC flows 10 times more slowly than saline.
  • The length and diameter of the IV catheter are controlled by the trauma professional who inserts it, and it has a massive impact on flow. This is particularly true for the diameter (gauge), which varies directly as the fourth power.

So let’s put all these numbers together. Let’s assume that we are using balanced resuscitation and are infusing lots of blood, not crystalloid. The choice of IV catheter is the most important factor for a successful volume resuscitation! Here’s a table I constructed that lists the approximate relative flow rates for several catheter types. I use a 9 Fr introducer as the gold standard and have defined the flow rate for that device as 1.

IV Catheter Internal Radius Length Relative flow
9 Fr Introducer 1.5 mm 10 cm 1
14 Ga IV 0.8 mm 5 cm 1/6 x
Triple lumen cath 0.3 mm 20 cm 1/1265 x

Bottom line: High-speed volume resuscitation forces us to squeeze a thick (and hopefully warm) liquid through a small straw into our patient’s vein. The smaller and longer the straw, the harder it is to do that. I think that people underestimate how much of an impact the choice of catheter makes.

Always use the largest and shortest possible access for rapid infusion. Ideally, this should be a large, straight introducer. Some have a side port (e.g. Cordis) at a right angle to the catheter, but this introduces some extra resistance and will slow the infusion rate. A large bore (14 Ga) short (2 inch) IV catheter is good, but will only flow at one sixth the rate of an introducer.

And never use anything with more than one lumen! The typical triple lumen catheter has three lines that are either 20 or 21 Ga. They are tiny and very long. Looking at the table above, you will be lucky to infuse a few cc’s per minute through one of these, compared to hundreds of cc’s via a straight introducer.

References:

How Quickly Does Hemoglobin Drop After Acute Bleeding?

We all know that hemoglobin / hematocrit drop after blood loss. We can see it decreasing over the days after acute bleeding or a major operative procedure (think orthopedics). And we’ve been told that the hemoglobin value doesn’t drop immediately after acute blood loss.

But is it true? Or is it just dogma?

A reader sent me a request for some hard references to support this. When I read it, I knew I just had to dig into it. This is one of those topics that gets preached as dogma, and I’ve bought into it as well.

Now, I have personally observed both situations. Long ago, I had a patient with a spleen injury who was being monitored in the ICU with frequent vital signs and serial blood draws (but I don’t do that one anymore). He was doing well, then became acutely hypotensive. As he was being whisked off to the OR, his most recent hemoglobin came back at 10, which was little changed from his initial 11.5 and certainly no independent reason to worry.

But hypotension is a hard fail for nonoperative solid organ management. In the OR, anesthesia drew another Hgb at the end of the case, and the value came back 6.

Similarly, we’ve all taken care of patients who have had their pelvis fixed and watched their Hgb levels drop for days. Is this anecdotal or is it real? The doctor / nursing / EMS textbooks usually devote about one sentence to it, but there are no supporting references.

I was only able to locate a few older papers on this. The first looked at the effect of removing two units of red cells acutely. Unfortunately, the authors muddied the waters a little. They were only interested in the effect of the lost red cell mass on cardiac function, so they gave the plasma back. This kind of defeats the purpose, but it was possible to see what happened to Hgb levels over time.

Here were there findings over time for a group of 8 healthy men:

Time Hbg level
Before phlebotomy 14.4
1 week after 11.7
4 weeks after 12.6
8 weeks after 13.6
16 weeks after 13.9

So the nadir Hgb value occurred some time during the first week after the draw and took quite some time to build back up from bone marrow activity.

That’s the longer term picture for hemoglobin decrease and return to normal. What about more acutely? For this, I found a paper from a group in Beijing who was trying to measure the impact of Hgb loss from a 400cc blood donation on EEG patterns. Interesting.

But they did do pre- and post-donation hemoglobin values. They found that the average Hgb decreased from 14.0 to 13.5 g/dl during the study, which appeared to be brief. Unfortunately, this was the best I could find and it was not that helpful.

Bottom line: Your patient has lost whole blood. So, in theory, there should be no Hgb concentration difference at all. But our bodies are smart. The kidneys immediately sense the acute hypovolemia and begin retaining water. The causes ongoing hemodilution within seconds to minutes. Additionally, fluid in the interstitial space begins to move into the vascular space to replace the volume lost. And over a longer period of time, if no additional fluid is given the intracellular water will move out to the interstitium and into the vascular space.

But these things take time. There is an accelerating curve of hemodilution that takes place over hours. The slope of that curve depends on how much blood is lost. A typical 500cc blood transfusion will cause a 0.5 gm/dl drop over several minutes to an hour. We don’t have great data on the exact time to nadir, but my clinical observations support a hyperbolic curve that reaches the lowest Hgb level after about 3 days.

Unlike this curve, it levels off and slowly starts to rise after day 3-4 due to bone marrow activity.

The steepness of the curve depends on the magnitude of the blood loss. After a one unit donation, you may see a 0.5 gm/dl drop acutely, and a nadir of 1 gm/dl. In the case of the acutely bleeding patient with the spleen injury, the initial drop was 1.5 gm/dl. But two hours later it had dropped by over 5 gm/dl. 

Unfortunately, the supporting papers are weak because apparently no one was interesting in proving or disproving this. They were more interested in cardiac function or brain waves. But it does happen. 

Here’s the takeaway rule:

In a patient with acute bleeding, the initial hemoglobin drop is just the tip of the iceberg. Assume that this is only a third (or less) of how low it is going to go. If it has fallen outside of the “normal” range, call for blood. You’ll need it!

References:

  1. Effect on cardiovascular function and iron metabolism of the acute removal of 2 units of red cells. Transfusion 34(7):573-577, 1994.
  2. The Impact of a Regular Blood Donation on the Hematology
    and EEG of Healthy Young Male Blood Donors. Brain Topography 25:116-123, 2012.