Category Archives: Resuscitation

Best Of EAST 2023 #6: The Best Place To Intubate Bleeding Patients

Forty years ago, the presumption was that the best way to intubate a trauma patient was to take them to a fully equipped operating room and have an anesthesiologist perform it. Then, a few years later, we finally figured out it could be done in the emergency department. The key to doing it safely was that the trauma bay needed to look like an OR, with appropriate airway equipment, lights, and drugs. And you had to ensure that your intubator had sufficient skills.

But we are all too familiar with one subset of trauma patients much more sensitive to the intubation process: those who are bleeding and in shock. They are desperately compensating to attempt to maintain their vital signs as much as they can with their sympathetic tone. Unfortunately, the intubation process and the drugs we use can eliminate this reflex and lead to immediate hemodynamic collapse.

The trauma group at Johns Hopkins postulated that intubation in the ED could lead to worse outcomes in this particular group of patients. They analyzed three years of data from the National Trauma Data Bank dataset, isolating patients at Level I and Level II trauma centers who underwent immediate hemorrhage control surgery after arrival. Patients who were dead on arrival, intubated for airway concerns, or underwent resuscitative thoracotomy were excluded.

The authors used a regression model to determine any association between intubation and mortality. They also analyzed the usual secondary outcomes (complications [cardiac arrest, ARDS, AKI, sepsis], transfusions, and time in the ED).

Here are the factoids:

  • Nearly ten thousand patients at 253 trauma centers met inclusion criteria
  • Most patients were men with penetrating injury
  • One in five underwent intubation in the ED before their hemorrhage control operation and suffered a 17% mortality rate vs. 7% in the OR intubation group, which was a significant difference
  • Median dwell time in the ED was 31 minutes vs. 22 minutes in the OR group
  • Transfusion amount was significantly higher in the ED vs. OR group (6 vs. 4 units RBC)
  • Rates of all complications were significantly higher in the ED vs. OR groups (except sepsis)
  • Overall, cardiac arrest with CPR occurred in 10% of ED vs. 4% OR intubations
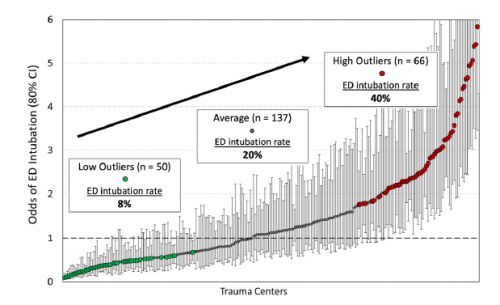
  • Centers that had low ED intubation rates generally had significantly lower post-intubation cardiac arrest events than those with higher ED intubation rates.

The authors concluded that ED intubation of patients requiring hemorrhage control was associated with multiple adverse events. They recommended that these patients be taken to the OR, where both intubation and rapid bleeding control can be achieved.

Bottom line: This nice, clean abstract addresses a simple question. Although it uses a large database, the authors focused on a limited number of variables, keeping the analysis uncomplicated.

The abstract paints a clear picture that agrees with the subjective observations of many trauma professionals that intubation in these patients can be dangerous. They found significant increases in mortality and complications in patients intubated in the ED.

Does this mean that the procedure is not being done as well there? Absolutely not! I believe the key is in the ED dwell time data, which shows an average of 9 more minutes spent there for intubation. Previous research has shown how even a few minutes count when it comes to hemorrhage control. This abstract provides some hard numbers that show how important it really is to get to the OR.

Here are my questions and comments for the presenter/authors:

  • First, a minor point: how can the “median” GCS be 15? Fifteen is the highest it can go. The median is the number where half the results are higher and half are lower. So if no results can be higher, none can be lower. Does this mean that every one of your 10K patients was wide awake?
  • Please explain the figure a little better. Does it just show the mix of low vs. average vs. high ED intubation rates? Or does it go along with the statement that high intubation rate centers have a higher likelihood of cardiac arrest in these patients?

I really enjoyed this abstract and am looking forward to any additional details provided at the presentation.

Reference: EMERGENCY DEPARTMENT VERSUS OPERATING ROOM INTUBATION OF PATIENTS UNDERGOING IMMEDIATE HEMORRHAGE CONTROL SURGERY, EAST 2023 Podium paper #13.

Best Of EAST 2023 #4: Whole Blood In Patients With Shock And TBI

We know that even a brief shock episode in patients with severe TBI dramatically increases mortality. Therefore, standard practice is to ensure good oxygenation with supplemental O2 and an adequate airway ASAP and to guard against hypotension with crystalloids and blood if needed.

Many papers (and several abstracts in this bunch) have been written about the benefits of whole blood transfusion. The group at the University of Texas in Houston compiled a prospective database of their experience with emergency release blood product usage in patients with hemorrhagic shock.

They massaged this database, analyzing a subset of patients with severe TBI, defined as AIS Head of 3. They specifically looked at mortality and outcome  differences between those who received whole blood and those who received component therapy.

Here are the factoids:

  • A total of 564 patients met the TBI + shock criteria, and 341 (60%) received whole blood
  • Patients receiving whole blood  had higher ISS (34 vs. 29), lower blood pressure (104 vs. 118), and higher lactate (4.3 vs. 3.6), all indicators of more severe injury
  • Initial univariate analysis did not identify any mortality difference, but using a weighted multivariate model teased out decreases in overall mortality, death from the TBI, and blood product usage
  • Neither statistical model demonstrated any difference in discharge disposition of ventilator days

The authors concluded that whole blood transfusion in patients with both hemorrhagic shock and TBI was associated with decreased mortality and blood product utilization.

Bottom line: This is yet another study trying to tease out the benefits of giving whole blood. The results are intriguing and show an association between whole blood use and survival. But remember, this type of study does not establish causality. It’s not possible to rule out other variables that were not available or not considered that could be the cause of the difference.

In this type of study, it’s essential to look at the design. Was it possible to create the study to record a complete set of variables that the researchers thought might contribute to the outcomes? Or is it a retrospective analysis of someone else’s data that contains just a few of them? This study falls into the latter category, so we have fewer data elements to work with and the likelihood that others that are not present could contribute to the outcomes.

The details of the multivariate analysis are also important. The authors stated that weighted multivariate analyses were performed. It’s not possible to provide details in a standard abstract, but these will be important for the audience to understand.

Here are my questions and comments for the presenter/authors:

  • Tell us more about the database you used for the analysis. What was the purpose? How many data elements did you collect, and how are they related to your research questions?
  • How did you decide which variables to include in your multivariate analysis? And how did you determine the weights? These can have a significant effect on your results.
  • This is a preliminary proof of idea study. How should this be followed up to move from association to causation?

This is just one of many exciting studies trying to shed light on the forgotten benefits of whole blood in trauma. I’m looking forward to seeing the final manuscript!

Reference:  PATIENTS WITH BOTH TRAUMATIC BRAIN INJURY AND HEMORRHAGIC SHOCK BENEFIT FROM RESUSCITATION WITH WHOLE BLOOD. EAST 2023 Podium paper #2.

Best Of EAST 2023 #3: The Cost Of Whole Blood vs Component Therapy

Decades ago, blood banks discovered they could fractionate units of whole blood into components for focused use. This was useful for patients who were thrombocytopenic or needed specific plasma factors. But trauma patients bleed whole blood, and trying to reassemble whole blood from components does not work well. Have a look at this chart:

It all comes down to money. Blood banks found they could charge more for the sum of the components of a unit of whole blood rather than the one unit itself. But now, with whole blood in trauma becoming a thing again, it’s essential to reexamine costs.

The University of Texas at San Antonio group examined transfusion-related charges for trauma patients receiving either component therapy or low-titer O+ whole blood within six hours of arrival. This was a retrospective review of prospectively collected data. During the first two years, only component therapy was given. Whole blood was introduced during the last four years.

Here are the factoids:

  • Once the trauma center switched to whole blood, total annual transfusion charges, as well as component charges decreased by 17% overall
  • In both adults and children, whole blood was associated with a significantly lower cost per ml delivered and cost per patient throughout all phases of care
  • In severely injured patients (ISS>15), the same significantly lower costs were also noted
  • Patients who triggered the massive transfusion protocol also had a lower cost per ml of product in the ED and the first 24 hours

The authors concluded that whole blood was associated with lower charges and “improved logistics,” especially in massive transfusion patients.

Bottom line: This is an interesting and important paper. However, several questions still need to be answered. I recognize that there is limited space in an abstract, so I will list them below in hopes the authors will answer them during the presentation.

The first issue is that the numbers of patients and quantities of blood products given need to be listed. These are very important because the figures list only total charges and maybe costs. These numbers are not per unit of product, so the data may be skewed if the number of patients was different between the groups. For example, if 100 patients received component therapy and only 10 got whole blood, costs or charges could definitely be skewed.

And then there is the cost vs. charge confusion. The abstract seems to use them interchangeably. The methods section of the abstract states that charges were analyzed. Yet cost is mentioned in the results, and figure two shows “cost” on the axes, but the caption states that charges were listed. 

We all know that hospitals can charge whatever they like, and that amount may vary based on insurance and other factors. The relationship between the charge and the cost is tenuous at best. Hopefully, the authors will clarify this at the start of the presentation.

Here are my comments and questions for the presenter/authors:

  • Please clarify the concept of charges vs. costs at the presentation’s beginning. If you truly analyzed only charges, do they bear any relationship to the actual costs of the units?
  • Shouldn’t your analysis of annual “charges” for product expenditures in Figure 1 be per unit? Otherwise, the costs and charges could be lower if fewer products were given after whole blood was introduced.
  • Was the switch to whole blood absolute, or was component therapy still given in some cases after 2018? If the switch was not total, there could be a selection bias in patients who received whole blood.
  • Figure 2 also appears to be total charges (or costs), not per patient or unit. But, again, without numbers it is difficult to say if the dollar differences are significant.
  • What are the “improved logistics” mentioned in the conclusion section? And how could they lower charges (or costs) in your study?

Lots of questions. I think you will need to provide a lot of explanation up front to justify your findings. Nevertheless, I’m excited about the presentation.

Reference: TRANSFUSION-RELATED COST COMPARISON OF TRAUMA PATIENTS RECEIVING WHOLE BLOOD VERSUS COMPONENT THERAPY. EAST 2023 podium abstract #28.

Best of EAST 2023 #2: REBOA In Cardiac Arrest

Resuscitative Endovascular Balloon Occlusion of the Aorta (REBOA) remains one of the shiny new trauma toys. Yet, with nearly a decade of human study, we are still struggling to define the right patients to benefit from it.

A group of REBOA superfans sought to perform a secondary analysis of a research database from the US Department of Defense of patients at six Level I centers in the US. It contained outcomes of patients in hemorrhagic shock due to non-compressible bleeding below the diaphragm. The authors analyzed the subset of patients who presented in cardiac arrest and underwent either REBOA or resuscitative thoracotomy (RT).

Here are the factoids:

  • There were 454 patients in the database, and 72 underwent either REBOA or RT
  • REBOA patients were significantly older (46 vs. 35 years) and were more commonly victims of blunt injury (81% vs. 46%)
  • AIS for abdomen was lower in the REBOA group, but AIS head and chest were the same
  • Times from arrival to aortic occlusion and to procedure completion were significantly longer in the REBOA group
  • REBOA patients received more red cells and plasma in the ED, but 24-hour transfusions were the same
  • Mortality was the same between REBOA and RT, and did not change even after some statistical magic

The authors concluded that REBOA was not associated with a survival or transfusion advantage in patients already in arrest.

Bottom line: I was amazed to see a negative result from a group who tend to be avid REBOA cheerleaders. And although the abstract conforms to my own bias about REBOA, there are several things to consider here. 

First, the sample size is very small. A total of 72 patients from the database fit the cardiac arrest on arrival criterion. There is also no information on prehospital arrest duration for the patients.  The dead tend to stay dead despite just about any intervention.

Here are my questions for the presenter and authors:

  • Have you performed a power analysis to determine how many patients were needed to show real differences between the groups? Were you getting close with the 72, or a lot more needed?
  • Also, you did not break down how many of the 72 patients were in the REBOA vs RT groups. Please provide those numbers.
  • Were you able to determine how long the patients had been in arrest before arrival? This could definitely influence survival rates.
  • Did you analyze the subset of survivors in each group? You noted that times to procedure start and completion were longer with REBOA. Did the survivors get to aortic occlusion sooner? Could you identify any subjective factors that seemed associated with their survival?

I wouldn’t get too depressed yet about the efficacy of REBOA in these patients. This study just tells us that REBOA is not a miracle cure for cardiac arrest, but we can still continue to learn more about this device and which patients it is best suited for.

Reference: REBOA AND RESUSCITATIVE THORACOTOMY ARE ASSOCIATED WITH SIMILAR OUTCOMES AFTER TRAUMATIC CARDIAC ARREST. EAST 2023 podium abstract #11.


How To Remember Those “Classes of Hemorrhage”

The Advanced Trauma Life Support course lists “classes of hemorrhage”, and various other sources list a similar classification for shock. I’ve not been able to pinpoint where these concepts came from, exactly. But I am sure of one thing: you will be tested on it at some point in your lifetime.

Here’s the table used by the ATLS course:

classes_of_shock

The question you will always be asked is:

What class of hemorrhage (or what % of blood volume loss) is the first to demonstrate systolic hypotension?

This is important because prehospital providers and those in the ED typically rely on systolic blood pressure to figure out if their patient is in trouble.

The answer is Class III, or 30-40%. But how do you remember the damn percentages?

multiscore-maxi1

It’s easy! The numbers are all tennis scores. Here’s how to remember them:

Class I up to 15% Love – 15
Class II 15-30% 15 – 30
Class III 30-40 30 – 40
Class IV >40% Game (almost) over!

Bottom line: Never miss that question again!