Category Archives: Prehospital

Hitting The Brakes May Increase Intracranial Pressure During The Ambulance Ride!

One of the most common injuries encountered by trauma professionals is blunt head trauma, and it’s one of the leading causes of death in young people. Keeping the level of intracranial pressure (ICP) within a specified range is one of the basic tenets of critical neurotrauma care in these patients. Most trauma centers have sophisticated algorithms that provide treatment guidance for various levels of ICP or cerebral perfusion.

The vast majority of patients with severe head injuries are transported to the hospital in some type of ambulance. Obviously, the exact ICP level is not known during transport because no monitoring device is present. We can sometimes infer that ICP is elevated if the patient has a Cushing response (wide pulse pressure and bradycardia) or unequal pupils. But for the most part, we assume that ICP is in a steady state during the ambulance ride.

But here’s something I never considered before: can ambulance acceleration or deceleration change the ICP through shifting of the brain or cerebrospinal fluid?

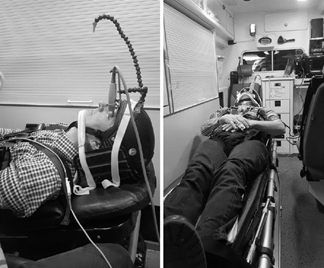
Patients are generally loaded into ambulances head-first, with their feet toward the back door. Frequently, they must be positioned supine in consideration of possible thoracic or lumbar spine injury. This position itself may lead to an increase in ICP. But what happens when the ambulance is hitting the brakes as it approaches a light or stop sign? As the patient’s weight shifts toward the top of the head, so does the CSF, spinal cord, and brain. Couldn’t this, too, increase ICP?

The anesthesiology group at the Erasmus Medical Center in Rotterdam, Holland performed a very novel study to assess this very thing. They recruited twenty participants in whom they evaluated ICP in various positions during acceleration and deceleration.
No, the subjects did not have an actual invasive ICP monitor inserted.

The authors used a novel way to infer pressures: optic nerve sheath diameter (ONSD). The optic nerves are direct extensions of the brain, and CSF travels freely in the nerve sheath. As ICP rises, the diameter of the nerve sheath increases. The subjects were fitted with a special helmet with two devices mounted on it. The first was a 7.5 Mhz ultra-sound probe focused on the back of the eye. The second was an arm with an orange dot on the end. This was adjusted so that the ultrasound probe was pointing at the optic nerve sheath when the other eye was focused on the dot. Subjects just watched the dot and measurements streamed in! Crude but very effective.

Baseline measurements were taken without acceleration or deceleration, then repeated when accelerating to 50 km/hr and decelerating to a stop.

Here are the factoids:

  • A total of 20 subjects were tested, and their oxygen saturation, blood pressure, and pulse were identical pre- and post-test
  • Baseline ONSD was about 5mm; a relevant change in diameter was determined to be more than 0.2 mm
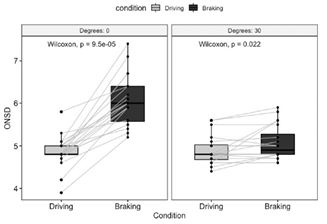
  • Lying supine, the ONSD in nearly all subjects increased from an average 4.8 to 6.0 mm during deceleration
  • With the head raised to 30º, most values remained steady (from 4.8 to 4.9 mm) during deceleration

The left block shows the increase in size of the optic disk with braking while supine. The right one demonstrates that this effect is neutralized by elevating the head 30º.

Bottom line: This is a small, simple, and creative study, yet the results are very interesting! It is clear that optic nerve sheath diameter increases significantly during deceleration in patients who are supine. And this effect is eliminated if the head of bed is elevated 30º.

Unfortunately, we have no idea how the change in ONSD corresponds to absolute values of, or relative increases in, ICP. Does a change of 1.2mm indicate a 5 torr increase in ICP? A 5% increase? Is it proportional to the absolute ICP? We just don’t know.

But the data is clear that a measurable change does occur. Until better data is available, it may be desirable to transport patients with serious head injuries with the head elevated to 30º if there are no concerns for lower spine injury. Or failing that, make sure the driver does not have a lead foot!

Reference: Ambulance deceleration causes increased intra cranial pressure in supine position: a prospective observational prove of principle study. Scand J Trauma Open Access 29:87, 2021.

Uber / Lyft For Medical Transport???

In this day and age of ride sharing apps like Uber and Lyft, it is possible to get a cheap ride virtually anywhere there is car service and a smart phone. And of course, some people have used these services for transportation to the hospital in lieu of an ambulance ride. What might the impact be of ride services on patient transport, for both patient and EMS?

Ambulance rides are expensive. Depending on region, they may range from $500-$5000. And although insurance may reduce the out of pocket cost, it can still be expensive. So what are the pros vs the cons of using Uber or Lyft for medical transport?

Pros:

  • Ride shares are inexpensive compared to an ambulance ride
  • They may arrive more quickly because they tend to circulate around an area, as opposed to using a fixed base
  • Riders may select their preferred hospital without being overridden by EMS (although it may be an incorrect choice)
  • May reduce EMS usage for low acuity patients

Cons:

  • No professional medical care available during the ride
  • May end up being slower due to lack of lights and siren
  • Damage fees of $250+ for messing up the car

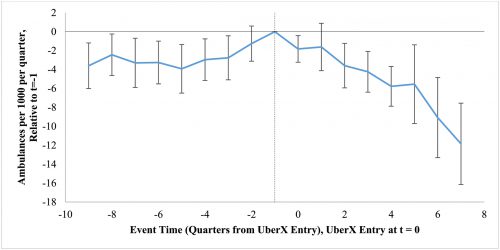
A very interesting paper suggests that ambulance service calls decreased by 7% after the introduction of UberX rides.  The authors mapped out areas where UberX rides were launching, and examined emergency response data in these areas. They used a complex algorithm to examine trends over time in over 700 cities in the US, and used several techniques to try to account for other factors. Here is a chart of the very fascinating results:

Bottom line: Uber and Lyft are just another version of the “arrival by private vehicle” paradigm. Use of these services relies on the customer/patient having very good judgment and insight into their medical conditions and care needs. And from personal experience, this is not always the case. I would not encourage the general public to use these services for medical transport, and neither do the companies themselves!

Reference: Did UberX Reduce Ambulance Volume? Health Econ 28(7)L817-829, 2019.

Trauma Activation vs Stroke Code

Let’s look at an uncommon scenario that crops up from time to time. Most seasoned trauma professionals have seen this one a time or two:

An elderly male is driving on a sunny afternoon, and crashes his car into a highway divider at  25 miles per hour. EMS responds and notes that he has a few facial lacerations, is awake but confused. They note some possible facial asymmetry  and perhaps a bit of upper extremity weakness. No medical history is available. Witnesses state that he was driving erratically before he crashed. Medics call the receiving trauma center in advance to advise them that they have a stroke code.

Is this a reasonable request? Stroke centers pride themselves on the speed of their stroke teams in assessing, scanning, and when appropriate, administering thrombolytics to resolve the problem. But if there are suspicions of stroke in a trauma patient, which diagnosis wins? Trauma team or stroke team?

Lets analyze this a bit further, starting with diagnosis. Remember the first law of trauma:

Any anomaly in your trauma patient is due to trauma, no matter how unlikely it may seem.

Could the symptoms that the paramedics are observing be due to the car crash? Absolutely! The patient could have a subdural or epidural hematoma that is compressing a cranial nerve. There might be a central cord injury causing the arm weakness. His TBI might be the source of his confusion. The facial asymmetry could be due to a pre-existing Bell’s palsy, or he could have had a stroke years ago from which he has only partially recovered.

If the stroke team is called for the patient, they will focus on the neuro exam and the brain. They will not think about trauma. They will follow the patient to CT scan looking for the thing that they do best with. If they don’t see it, the patient will return to the ED for (hopefully) a full trauma workup. If there are occult injuries in the abdomen, then the patient may have been bleeding for an hour by then. This elderly patient will then be way behind the eight ball.

And let me pose the worst case scenario. The patient is taken to CT by the stroke team, and lo and behold he has a thrombotic stroke!  This patient had a stroke, which caused him to lose control of his car and explains most of his findings. Again, the stroke team will do what they are trained to do and give a thrombolytic. They are still not thinking about trauma. Within minutes the patient becomes hypotensive and his abdomen appears a bit more distended. He is rushed back to the ED (remember, no CT in hypotensive patients even if you are in the scanner) and a FAST exam is very positive for free fluid throughout the abdomen. Imagine the look you will get from the surgeon as they run to the OR to perform a splenectomy on this fully anticoagulated patient!

Bottom line: If you have a patient who is trauma vs stroke, trauma always wins! Remember the first law and try to find traumatic reasons for all signs and symptoms. Perform your standard trauma workup and incorporate the appropriate head scans into your evaluation. Then and only then should the stroke team be called.

How Long Does It Take EMS To Get To A Scene?

How long does it take for EMS to get to the scene of an emergency? That’s a loaded question, because there are many, many factors that can impact this timing. If you look at the existing literature, there are few, if any, articles that have actually looked at this successfully.

A group from Aurora, IL and Wake Forest reviewed EMS records from across the country, spanning 485 agencies over a one year period. Only 911 responses were reviewed, and outliers with arrival times of more than 2 hours and transport times of 3 hours were excluded. Over 1.7 million records were analyzed, and 625 were excluded for this reason.

Here are the factoids:

  • In 71% of cases, the patient was transported to a hospital. In one quarter of cases, they were evaluated but not transported. 1% were dead on arrival, and in 2% no patient was found at the scene (!)
  • 4% of patients were transported in rural zip codes, 88% in suburban ones, and 8% from urban locations
  • Overall response time averaged 7 minutes
  • Median response times were 13 minutes for rural locations, and 6 minutes for both suburban and urban locations
  • Nearly 1 in 10 patients waited 30 minutes for EMS response in rural locations

Bottom line: There is an obvious difference in EMS response times between rural and urban/suburban locations. And there are many potential reasons for this, including a larger geographic area to be covered, volunteer vs paid squads, etc. Many of these factors are difficult, if not impossible to change. The simple fact that it takes longer to reach these patients increases their potential morbidity and mortality. Remember, time is of the essence in trauma. The patient is bleeding to death until proven otherwise. It is far easier and cost-effective to equip bystanders with the skills to assist those in need (basic first aid, CPR, Stop the Bleed, etc) while waiting for EMS to arrive.

Reference: Emergency Medical Services Response Times in Rural, Suburban, and Urban Areas.  JAMA Surg 152(10): 983–984, 2017.

Can Prehospital Providers Accurately Estimate Blood Loss? Part 2

I’ve previously written about the difficulties estimating how much blood is on the ground at the trauma scene. In general, EMS providers underestimated blood loss 87% of the time. The experience level of the medic was of no help, and the accuracy actually got worse with larger amounts of blood lost!

A group in Hong Kong developed a color coded chart (nomogram) to assist with estimation of blood loss at the scene. It translated the area of blood on a non-absorbent surface to the volume lost. A convenience study was designed to judge the accuracy that  could be achieved using the nomogram. Sixty one providers were selected, and estimated the size of four pools of blood, both before and after a 2 minute training session on the nomogram.

Here’s what it looks like:

Note the areas across the bottom. In addition to colored square areas, the orange block is a quick estimate of the size of a piece of paper (A4 size since they’re in Hong Kong!)

Here are the factoids:

  • The 61 subjects had an average of 3 years of experience
  • Four scenarios were presented to each: 180ml, 470ml, 940ml, and 1550ml. These did not correspond exactly to any of the color blocks.
  • Before nomogram use, underestimation of blood loss increased as the pool of blood was larger, similar to the previous study
  • There was a significant increase in accuracy for all 4 scenarios using the nomogram, and underestimation was significantly better for all but the 940ml group
  • Median percentage of error was 43% before nomogram training, vs only 23% after. This was highly significant.

Bottom line: This is a really cool idea, and can make estimation of field blood loss more accurate. All the medic needs to do is know the length of their shoe and the width of their hand in cm. They can then estimate the length and width of the pool of blood and refer to the chart . Extrapolation between colors is very simple, just look at the line. The only drawback I can see occurs when the blood is on an irregular or more absorbent surface (grass, inside of a car). 

Related posts:

Reference:  Improvement of blood loss volume estimation by paramedics using a pictorial nomogram: a developmental study. Injury article in press Oct 2017.