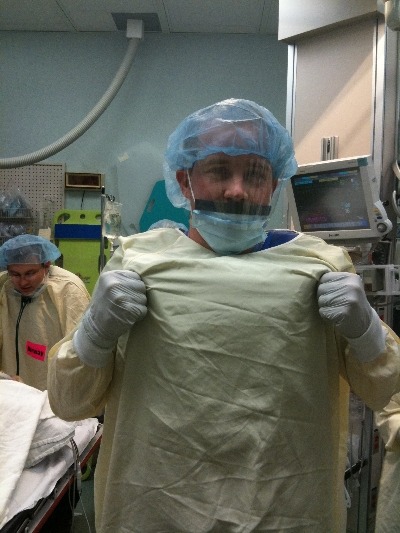
Trauma Team members typically wear a lead gown under their personal protective equipment so they don’t have to run out of the room when x-rays are taken. How often do you see people do this?
Is it really necessary? Tomorrow I’ll talk about how much radiation team members are really exposed to.
Yes, it is practically dogma that CT should not be used in unstable trauma patients. Either they go directly to the OR, or an attempt to stabilize them is briefly undertaken in the trauma bay. And as you know, I’m not a big believer in dogma. But this one has withstood the test of time. You can see my comments about a previous paper below in the related posts.
But now some authors in Colombia have published a paper that seems to call this idea into question. Could it be true? Read carefully!
This was a small, retrospective review of patients from a large Level I government designated trauma center. They reviewed their experience over a two year period, identifying all hemodynamically unstable patients in the registry. They excluded dead patients, those with isolated head injury, and any who had surgery at an outside hospital prior to transfer.
Here are the factoids:
171 patients were reviewed, and of course they tended to be young males
91 went straight to the OR, and 80 were taken to CT first
“Unstable” patients were defined as having SBP < 100 and/or HR > 100
Mechanism of injury for the OR group was 95% penetrating, but for the CT group was about 50:50 penetrating/blunt
The mean SBP and HR for the “unstable” patients taken to CT were 92 and 110, respectively
Mortality was the same for both groups (18% OR vs `13% CT)
Bottom line: The authors concluded that it is permissible to take unstable patients to CT if you don’t spend too much time there based on similar mortality rates. But the problem was that I don’t consider their patients to have been unstable! Mean SBP in their “unstable” group was over 90 torr and the heart rate was only 110! The lowest SBP was only 79. And mortality is too crude of an outcome to rely on. Furthermore, the patients they took to CT tended to have blunt mechanisms, and may not have had ample efforts at resuscitation in the trauma bay first, or may have met criteria to go to CT anyway (see related posts below).
Reference: Computed tomography in hemodynamically unstable severely injured blunt and penetrating trauma patients. J Trauma 80(4):597-603, 2016.
Ever wonder what is going on when you drag your mouse across a CT image, or when you change the “window” settings of an image from lung to abdomen? It all has to do with the way CT generated xray information is displayed, and how your eyes and brain perceive it.
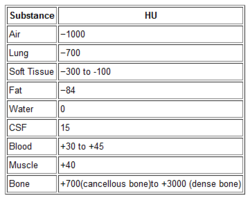
Let’s get down to basics. The first thing needed is to understand the concept of radiodensity. The CT scanner uses a set of software algorithms to determine the amount of x-radiation absorbed by every element in a plane of tissue. Each of these elements is represented by a pixel on the video display, and the density (amount of x-radiation absorbed) is measured in Hounsfield units. This scale was developed by Sir Godfrey Hounsfield, who set the radiodensity of water at 0, and air at -1000. The scale extends in the positive direction to about +4000, which represents very dense metals. See the table for the density of common substances on CT.
When you view a CT scan on a video display, two important numbers are displayed on screen. The first is the window width (W), which describes the range of Hounsfield units displayed. The maximum window width possible is usually about 2000, but our eyes are not capable of seeing this many shades. Actually, we can really only distinguish about 16 shades of gray. So the window width is divided by 16, and each group of Hounsfield values is converted to one of 16 shades of gray. The lowest Hounsfield numbers in the window range are shown as black, and the highest are white.
The second important number is the window level (L). This is the Hounsfield number in the center of the window width. So let’s look at some typical examples of W/L settings.
The abdomen contains mostly soft tissue, which is just a little denser than water. So most of the abdominal contents have Hounsfield values from 0 to 100 or so. A typical abdominal scan W/L setting is 350/50. This means that a total range of 350 different densities are displayed, centered on a density of 50 Hounsfield units ( range is -125 to 225 HU). Each difference of 22 HU will show up as a different shade of gray. So this narrow window allows us to distinguish relatively subtle differences in density.
The chest cavities are primarily air-filled, and the lungs are very low density. So it makes sense that a typical lung W/L setting is 1500/-500. The window ranges from -1250 to +250 HU, and a wider range of 94 HU represents one shade of gray. This is typical of body regions with a wider range of densities.
Finally, bone windows are usually 2000/250. This window is centered above the usual tissue densities, and is very wide so that it shows a wide range of densities in only 16 shades of gray. Thus, the contrast appears very low.
On most displays, the window width increases as you drag the mouse to the right. This increases the range of densities in a shade of gray, thus decreasing the overall amount of contrast in the image. Dragging the mouse down decreases the window level, moving it toward the air end of the spectrum. This allows you to center your window on the type of tissue you are interested in viewing and adjust your ability to distinguish objects with a lot or only a little contrast (see table above).
I apologize to my radiology colleagues in advance for this simplistic explanation. Trauma professionals have minimal exposure (pun intended) to the physics and details of radiographic imaging. We are much more interested in effectively using this technology to save our patients’ lives.
Diagnostic imaging is a mainstay in diagnosing injuries in major trauma patients. But the big questions are, how much is enough and how much is too much? X-radiation is invisible but not inocuous. Trauma professionals tend to pay little attention to radiation that they can’t see in order to diagnose things they can’t otherwise see. And which may not even be there.
There are two major camps working in emergency departments: scan selectively and scan everything. It all boils down to a balance between irradiating enough to be satisfied that nothing has been missed, and irradiating too much and causing harm later.
A very enlightening study was published last year from the group at the University of New South Wales. They prospectively looked at their experience while moving from selective scanning to pan-scanning.They studied over 600 patients in each cohort, looking at radiation exposure, missed injuries, and patient injury and discharge disposition variables.
Here are the interesting findings:
Absolute risk of receiving a higher radiation dose increased from 12% to 20%. This translates to 1 extra person of every 13 evaluated receiving a higher dose.
The incidence of receiving >20 mSv radiation dose nearly doubled after pan-scanning. This is the threshold at which we believe that cancer risk changes from low (<1:1000) to moderate (>1:1000).
The risk of receiving >20 mSv was lower in less severely injured patients (sigh of relief)
There were 6 missed injuries with selective scanning and 4 with pan-scanning (not significant). All were relatively minor.
Bottom line: Granted, the study groups are relatively small, and the science behind radiation risk is not very exact. But this study is very provocative because it shows that radiation dose increases significantly when pan-scan is used, but there was no benefit in terms of decreased missed injury. If we look at the likelihood of being helped vs harmed, patients are 26 times more likely to be harmed in the long term as they are to be helped in the short term. The defensive medicine naysayers will always argue about “that one catastrophic case” that will be missed, but I’m concerned that we’re creating some problems for our patients in the distant future that we are not worrying enough about right now.
Reference: Comparison of radiation exposure of trauma patients from diagnostic radiology procedures before and after the introduction of a panscan protocol. Emerg Med Australasia 24(1):43-51, 2012.
Time for a little philosophy today. There seem to be two camps in the world of initial diagnostic testing for trauma: selective scanning vs scan everything. I admit that I am one of the former. Yes, the more tests you do, the more things you will find. Some will be red herrings. Some may be true positives, but are they important? Here’s the key question:
“If a tree falls in a forest and no one is around, does it make a sound?”
There is a clinical corollary to this question in the field of trauma:
“If an injury exists but no one diagnoses it, does it make a difference (if there would be no change in treatment)?”
Here’s an example. On occasion, my colleagues want to order diagnostic studies that won’t make any clinical difference, in my opinion. A prime example is getting a chest CT after a simple blunt assault. A plain chest xray is routine, and if injuries are seen or the physical exam points to certain diagnoses, appropriate interventions should be taken. But adding a chest CT does not help. Nothing more than the usual pain management, pulmonary toilet, and an occasional chest tube will be needed, and those can be determined without the CT.
Trauma professionals need to realize that we don’t need to know absolutely every diagnosis that a patient has. Ones that need no treatment are of academic interest only, and can lead to accidental injury if we look for them too hard (radiation exposure, contrast reaction, extravasation into soft tissues to name a few). This is how we get started on the path to “defensive medicine.”
Bottom line: Think hard about every test you order. Consider what you are looking for, what you might find, and if it will change your management in any way. If it could, go ahead. But always consider the benefits versus the potential risks, or what I call the “juice to squeeze ratio.”
Tomorrow I’ll look at some of the “scan all” vs “scan selectively” literature. Which camp are you in?
References:
George Berkeley, A Treatise Concerning the Principles of Human Knowledge, 1734, section 45.
paraphrased by William Fossett, Natural States, 1754.
Home of the Trauma Professional's Blog
Do you want to get a daily email every time there’s a new post? See what I’m up to.