Category Archives: Imaging

CT Crystal Ball – Part 3

And yet another one of these crystal ball abstracts, all presented at the same meeting of the American College of Surgeons Clinical Congress!

This one postulates that more injuries seen on CT scan might predict mortality in “older” trauma patients. Hmmm. The authors pulled info  on head CT findings, GCS, AIS Head, lengths of stay, death, functional scores, and discharge disposition. And the age had to be >45 years. Older? Hmmm.

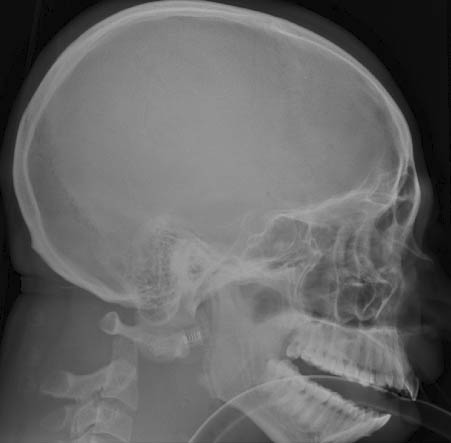
A scoring tool was designed that gave 1 point each for subdural, epidural, subarachnoid, or intraparenchymal blood, cerebral contusion, skull fracture, brain edema/herniation, midline shift, and external trauma to the head/face. The score range was 0-8, even though there were 10 factors.

Lets look at the factoids:

  • Nearly 10 years of data were analyzed
  • 620 patients meeting criteria were identified
  • The scoring system positively correlated with all of the outcome measures
  • Independent predictors of mortality included GCS, AIS Head, and the CT score (odds ratio 1.3)
  • The CT test also “predicted” (author’s word) neursurgical intervention (odds ratio 1.2)

Bottom line: Oh boy, here we go again. Another correlation study, and a weak one at that. So if someone told you that an “older” patient (beginning after age 45) would do worse clinically the more injuries were seen in and around their head, what would you say? And why did it take 10 years of data to accumulate data on 620 patients in this age range (62 per year)? And why not test your scoring system prospectively? And run some really good statistics on the new data?  Sadly, I feel this is another run to submit an abstract and present at a meeting. But thankfully, I don’t think it will ever see the light of print.

Related posts:

Reference: Prognostication of traumatic brain injury outcomes in older trauma patients: a novel risk assessment tool based on initial cranial CT findings. ACS Scientific Forum, trauma abstracts, 2016.

captain-obvious1

Print Friendly, PDF & Email

The CT Crystal Ball – Part 2

Yesterday, I wrote about a study that looked at a CT scan-derived index that promised to predict complications and mortality based on the waist-hip ratio. It was actually a very good one. But there is another abstract being presented at the American College of Surgeons Clinical Congress this week that promises miracles from the CT scanner as well.

This next abstract looks at muscle mass in trauma patients, as measured by CT scan. Specifically, the authors measured the density of the psoas muscle by determining its cross-sectional area and its density in Hounsfeld units. They then looked at the relationship between this and 90 day mortality, complications, and disposition location.

Really? Well, here are the factoids:

  • The study involved only 152 patients age 45+ from the year 2008
  • Median ISS was only 9
  • Patients with the lowest psoas cross-sectional area had an associated significantly higher death rate
  • Those with lowest psoas density had an associated increase in complications, dependency on discharge, and mortality
  • The authors suggest that these measurements could aid in patients who would benefit from aggressive nutritional support and physical therapy, and could aid in discharge planning

Bottom line: Very different from yesterday’s abstract. This one has no grounding in prior research. It appears to be one that was just dreamed up from nowhere. And it is truly an association study. No causality can or should be inferred.

There were only 152 patients studied. From 2008. Why? Why didn’t the authors use a more contemporary dataset? There is something weird going on behind the scenes. Is this an old study that was forgotten, and is just now being conveniently dusted off for analysis and submission? A power analysis to find out how many patients should be reviewed is not possible, so it is important to err on the high side. Not just 152 patients.

If you were to just read the abstract and especially the conclusions, you really might get the wrong idea. This is a study that will not see it’s day in any journal. Read and learn from it. But don’t duplicate it!

Related post:

Reference: Computed tomography-measured psoas density predicts complications, discharge location, and mortality in trauma patients. ACS Scientific Forum, trauma abstracts, 2016.


Print Friendly, PDF & Email

Using The CT Scan As A Crystal Ball For Trauma?

Two abstracts that are being presented at the American College of Surgeons Clinical Congress this week use CT scans to predict interesting things. They are things that you would not think a CT scanner should be able to do.

So can we use arcane measurements of things found on CT scan to make accurate predictions about our patients? Sure, if we see very low density bubbles (free air) in the abdomen, it’s pretty likely that some kind of abdominal catastrophe has occurred. Or if their is a large amount of high density fluid (blood) in the left chest after a stab wound, the patient will probably require a chest tube.

But what about other measurements that wouldn’t seem to be related to anything? Could we have found a magic crystal ball here, or is it just wishful thinking?

The first abstract evaluated the ability of the waist to hip ratio (WHR) to predict outcomes after trauma. Obviously, this is the width of the waist divided by the width of the body at the hips.

waist-hips-ratio1

Here are the factoids for this study:

  • 555 patients were analyzed retrospectively over 1 year at a Level I trauma center.
  • In-hospital complications and death were specifically analyzed
  • Using a receiver operating characteristic curve, the authors determined that a magic ratio of 1 was the best predictor
  • Complications were significantly higher in the group with WHR>1 (50% vs 19%) as was mortality (17% vs 7%)
  • Regression analysis showed that patients with WHR>1 were 4x more likely to have a complication and 3x more likely to die
  • WHR was only weakly correlated with BMI

Bottom line: WTF? How can this be, you ask? Just because your patient is a bit “fusiform” in shape, they have a rougher time after trauma? Well, in this case there may actually be some basis for the findings. There are thousands of articles in the literature that have identified that this shape actually is associated with higher complications and mortality in general. And there are already some published trauma papers that have confirmed this association. Interestingly, the BMI was less predictive that the WHR in this study, so this may be a better surrogate measure for obesity.

The number of patients enrolled is reasonable, and the statistics look sound (for just being an abstract). So there may be something here. However, before you start using the “measure tool” on your CT console on every trauma patient, wait for the confirmatory prospective studies to come along. 

Tomorrow, a look at a not-so-good study of this type, looking at an even more arcane metric on the CT scan.

Reference: Computed tomorgraphy-measured waist to hip ratio: a reliable predictor of outcomes after trauma. ACS Scientific Forum, trauma abstracts, 2016.

Print Friendly, PDF & Email

ED Use of CT – Everyone Does It Differently

There is tremendous variability in ordering imaging in trauma patients. To some degree, this is due to the dearth of standards pertaining to radiographic imaging, at least in trauma. And when standards do exist, trauma professionals are not very good at adhering to them. We’d rather do it our way. Or the way we were trained to do it.

The group at Jamaica Hospital in Queens, NY quantified some of those differences, studying ordering patterns of trauma surgeons (TS), emergency physicians (EP), and surgery chief residents (CR). Unfortunately, they then tried to draw some interesting conclusions, which I’ll discuss at the end.

They reviewed all blunt trauma activations over a 6 month period at their urban trauma center. At the end of each trauma activation, each of the three physician groups wrote imaging orders, but only the trauma surgeons’ were submitted. Missed injuries were defined as any that would not have been found based on each provider group’s orders. Extremity injuries, and those found on physical exam or plain imaging were excluded.

Here are the factoids:

  • The authors do not state how many patients they saw in this period, but by extrapolation it appears to be about 250
  • Trauma surgeons ordered significantly more studies (1,012) than the EPs (882) or CRs (884)
  • This resulted in essentially a “pan-scan” in 78%, 64%, and 69%, respectively
  • Radiation exposure was said to be the same for all groups (18 vs 13 vs 15 mSv) [I’m having a hard time buying this]
  • But cost was higher in the trauma surgeon group ($344 vs $267 vs $292) [Huh? Is this only the electric bill for the CT scanner? Very low, IMHO]
  • And the trauma surgeons had a missed injury rate of only 1%, vs 11% for EPs and 7% for CRs [Wow!]

Bottom line: Sorry, I just can’t believe these results. There are a lot of things left unsaid in this poster. What were all these missed injuries? What magical CT scan that only the trauma surgeons ordered actually picked them up? And probably most importantly, were they clinically significant? A small hematoma somewhere doesn’t make a difference (see the “tree falls in a forest” post below).

It looks to me like the authors wanted to justify their use of pan-scan, and push their emergency physicians to follow suit. Unfortunately, this is a poster presentation, meaning that there will be limited opportunity to question the authors about the specifics.

The debate regarding pan-scan vs selective imaging is an active one. The evidence is definitely not in yet. While we sort it out, the best path is to develop a reasonable imaging practice guideline based on the literature, where available. Some areas such as head and cervical spine CT have been worked out fairly well. Then fill in the blanks and encourage all trauma professionals in your hospital to follow them. There is great value in adhering to good guidelines, even when there are blanks in our knowledge.

Related posts:

Reference: Variability in computed tomography imaging of trauma patients among emergency department physicians and trauma surgeons with respect to missed injuries, radiation exposure and cost. AAST 2016, Poster #75.

Print Friendly, PDF & Email

Cervical Spine MRI After Negative CT

dislocation-atlanto-axial-0005

There are multiple ways to clear a cervical spine! Most centers use a combination of clinical decision tools and CT scan in adults. The gold standard tie breaker, warranted or not, seems to be MRI. This tool is only used in select cases where conventional imaging is in doubt, or the clinical exam is puzzling.

Some centers clear based on CT only as long as imaging is indicated. Some use MRI in cases where patients continue to complain of midline neck pain or tenderness after negative CT. A multi-center trial encompassing 8 Level I and II centers prospectively performed MRI on patients who could not be clinically evaluated, or had persistent midline cervical pain after normal CT.

A total of 767 patients were seen over a 30 month period. Besides looking at the usual data points, the authors were interested in new diagnoses and changes in management based on the MRI results.

Here are the factoids:

  • Neck pain and inability to evaluate occurred with equal frequency, about 45%; the remaining 10% had both
  • 23% of MRIs were abnormal, with 17% ligament injury, 4% swelling, 1% disk injury, and 1% dural hematomas.
  • Patients with normal and abnormal MRI had neurologic anomalies about equally (15-19%). [Why are these patients included? Were they initially not evaluable?]
  • The cervical collar was removed in 88% of patients with normal MRI (??), and in 13% with abnormal MRI
  • After (presumably) positive MRI, 14 (2%) underwent spine surgery; 8 of these had neurologic signs or symptoms

Bottom line: I’m a bit confused. If the authors were really trying to figure out the rate of abnormal MRI after negative CT, they should have excluded the patients with known neurologic findings. These patients should nearly always have an abnormal MRI. And why did they not take the collar off of the 12% of patients with both normal CT and MRI??

Hopefully, details in the presentation next week will help explain all this. I suspect that the study will show that there are cases where CT is normal but MRI is not. The abstract does not clearly describe how many of these are clinically significant.

I admit, I’m not very comfortable clearing the cervical spine in a patient with negative CT (even if read by a neuroradiologist) and obvious midline neck pain/tenderness. I hope this study helps clarify this issue. We shall see…

Reference: Cervical spine MRI in patients with negative CT: a prospective, multicenter study of the research consortium of New England centers for trauma (ReCONECT). AAST 2016, Paper 61.

Print Friendly, PDF & Email