EAST 2019 #4: Predicting Retained Hemothorax

Traumatic hemothorax is an interesting problem. Sometimes it clots, sometimes it doesn’t. Sometimes it sticks to the lung and causes a restrictive problem, sometimes it doesn’t. And even if it doesn’t fuse to the lung, having a moderate volume of retained blood can create significant functional problems.

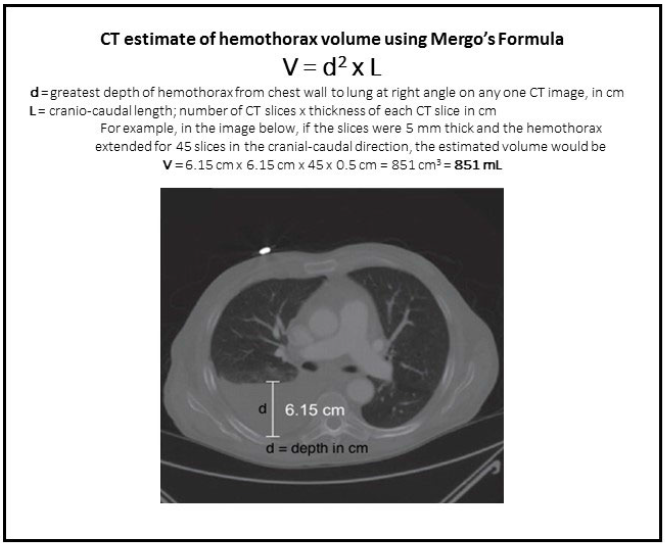
What if we could predict which hemothoraces would progress to retained hemothorax so we could intervene sooner and avoid complications and potential wasted time in the hospital? An EAST multi-institutional trial explored a possible technique for doing just that, postulating that an initial large volume hemothorax (HTX) would correlate with development of retained HTX. This study used data collected prospectively from 17 US trauma centers, and involved the use of Mergo’s formula to calculate the size of the HTX. This technique essentially estimates the volume of a cylinder that fits inside the largest diameter of the HTX seen on CT scan, extending the entire length of the thorax. Although this technique will underestimate the volume at the largest part of the HTX, it overestimates it above and below this point, so it probably all evens out. Roughly.

Here are the factoids:

  • 985 patients were enrolled and 1033 HTX were measured
  • Patients who developed retained HTX (defined as blood in the chest requiring intervention or subsequent identification of HTX by CT) were more likely to have penetrating trauma, pulmonary contusion, and had their HTX seen on initial chest x-ray (CXR)
  • Chest abbreviated injury score (AIS) was higher in patients with retained HTX, and their calculated HTX volume was larger
  • Chest tube size did not correlate with development of retained HTX
  • The authors concluded that patients who developed retained HTX had a lower initial hematocrit, higher chest AIS, and large volume seen on CT

Here are some questions for the authors and presenter to consider in advance to help them prepare for audience questions:

  • When and over what period of time was this data collected? It was not stated in the abstract. Very old or long-running data sets run the risk of technology (CT scan resolution) or practice (pigtail vs chest tube) changes.
  • Couldn’t the hematocrit and chest AIS factors be red herrings? Did this study look at all the other injuries that could have decreased the hematocrit or just focus on the chest injury? And the chest AIS automatically increases from 3 to 4 as the volume of the HTX increases. Could this skew your analysis?
  • One of the definitions of retained HTX (need for intervention) depends on clinical judgement and practice habits, which probably differ at the various trauma centers enrolled.
  • Only odds ratios were listed in the abstract. Even though the HCT and AIS numbers are statistically significantly different, I can’t tell if they are clinically significant. Be sure to share your means and standard deviation/error during your presentation.
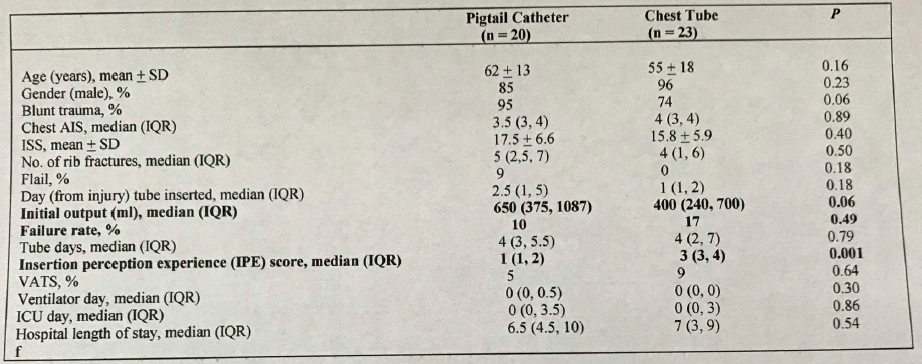
  • Did you lump pigtail catheters in with regular chest tubes? And did you look at the distribution of chest tube sizes? If all were large it would be hard to come to a good conclusion about size.
  • What about trauma centers who do not use CT on every trauma patient? Do we really need to CT someone who falls down, breaks a few ribs, and has a visible HTX on CXR?
  • Big picture: so what do we do now based on your findings? How do we plan re-imaging and potential surgical intervention in these patients?

This is very interesting work, and I look forward to the presentation!

Reference: Predictors of post-traumatic retained hemothorax: results of an EAST multi-institutional trial. EAST 2019 Paper #14.

EAST 2019 #3: Chest Tube vs Pigtail

I love stuff about chest tubes. There are so many opinions and so little data to back them up. And now here’s another EAST 2019 Annual Assembly paper from the University of Arizona at Tucson on chest tubes! The traditional dogma, and something that I’ve promoted for some time, is that the only size chest tube that should be used for hemothorax is big (36 Fr) or bigger (40 Fr). There have been a few abstracts and published papers over the past 7 years that are trying to change this assumption. Will they be successful?

The first work on this was a paper published in 2012 by this same group in Tucson. It was a prospective study that included 36 patients with pigtails and 191 with 32 Fr – 40 Fr chest tubes over 30 months. Average initial drain output was the same, and there were no differences in tube in time, complications, or failure rate.

A related abstract was then presented by this group at the 2013 EAST Annual Assembly, but it doesn’t look like this one got published. It was a small, prospective study that enrolled 40 of 72 eligible patients over 20 months and compared pigtail catheters vs 28 Fr chest tubes. They found that chest wall and tube site pain was less with a pigtail, and that failure and complication rates, tube in time, and hospital stay were the same.

And then in 2017 more related work was presented at EAST from the group, and was later published in the World Journal of Surgery. This study was the culmination of 7 years of experience, and included nearly 500 subjects. Once again, initial drainage output was the same, as were complications and failure rate. The authors concluded that a multi-center trial was need to provide additional support.

And that brings us up to EAST 2019. Now the authors are presenting a single-center study comparing 14 Fr pigtail vs 28-36 Fr chest tubes for hemothorax and pneumthorax. What’s different about this one? For the first time, the subjects were randomized between pigtail and chest tube in an effort to eliminate selection bias.

Here are the factoids:

  • A total of 43 patients were enrolled, but the number excluded was not given
  • Although baseline characteristics of the two groups were identical, several differences approached clinical significance: percent blunt trauma, flail chest, insertion day, and initial chest tube output
  • The authors concluded that there were no differences in initial chest tube output, failure rate, tube days, and lengths of stay. However, perceived pain was less.
  • They again noted that a multi-center trial should be performed to confirm these results

Here are some questions for the authors and presenter to consider in advance to help them prepare for audience questions:

  • What’s new and different with this study? The University of Arizona – Tucson has been studying pigtails since 2009. Tell us about the progression of this work and how the current study fits in.
  • How many patients were excluded? This is very important, especially if this number is high. What were the exclusion criteria exactly?
  • What did your power analysis show? The overall enrollment numbers are low, which may throw your statistics into doubt. This is especially true since your primary outcome showed that pigtail and chest tube outputs were the same but with a p=0.06! More patients may have helped show the desired difference.
  • Were the pigtail and chest tube groups really “similar?” There were more penetrating injuries in the chest tube group. Could this have an impact on clotted vs non-clotted blood in the chest and the ability of a pigtail to drain it? And the median pigtail insertion date was 1.5 days later than for chest tubes, which is clinically significant. Could this allow time for defibrination of the hemothorax, resulting in better drainage?
  • And what’s next? Will I see you again at EAST 2020 or 2021 with a larger prospective study? Or a multi-center one?

I’m looking forward to hearing this one in person!

References:

  • A single center prospective randomized study comparing the effectiveness of 14 French percutaneous catheters (pigtail) versus 28-36 French chest tube in the management of traumatic hemothorax/hemopneumothorax. EAST 2019 Paper #13.
  • EAST abstract presentation 2013.
  • EAST abstract presentation 2017.

EAST 2019 #2: Utilization of Damage Control Laparotomy

The next paper presentation I’ll review from the upcoming EAST Annual Assembly is from a consortium of six US trauma programs, and appears to be under the direction of faculty at the McGovern Medical School in Houston. They recognized that rates of damage control laparotomy (DCL) vary widely throughout the US. In part, this is due to the lack of hard and fast indications for the application of this procedure. This procedure is used in cases where patient physiology (or trends in that physiology) would suggest that persisting with an open body cavity would lead to hypothermia, coagulopathy, additional injury, or death.

This study entailed the prospective review of every DCL performed at the centers over a one year period. Each was adjudicated by a majority faculty vote as to whether it would have been safe and appropriate to perform a definitive laparotomy (DL) instead. DL means that all injuries are fixed and the abdomen is closed.

Here are the factoids:

  • 872 trauma laparotomies were performed: 209 DCL and 639 DL. There were 24 intraoperative deaths.
  • There was no change in DCL rate compared to historical controls for 5 of the 6 centers (see diagram)
  • One center had an initial reduction in DCL rate, but this disappeared throughout the rest of the study
  • The voting group found consensus in recommending DCL with hemodynamic instability or if packing was required, but could not agree on the need for second look procedures

Overall, this intervention (reviewing each and every damage control procedure immediately after) did not decrease the DCL rate as hoped. The authors cited the second look laparotomy disagreement as a possible target to improve results.

Here are some questions for the authors and presenter to consider in advance to help them prepare for audience questions:

  • All DCLs are not the same. Six different centers were studied, each with their own DCL popluation. What was the blunt:penetrating mix for each? What were the specific mechanisms and injuries sustained? ISS? It could be that the study group was not homogeneous, making it more difficult to judge appropriateness.
  • Was the study powered well enough to detect differences? The total number of DCL cases was only 209, or 35 per center. And of course, some had more, some less. In our original DCL paper from Penn, the clinical significance first showed up only in the subset of most severely injured penetrating injury patients. Did you have enough patients?
  • What exactly was the intervention that would drive down the DCL rate? Although this is (kind of) a prospective project, the analysis of each case and the consensus vote took place after each procedure. Was this done at each institution, or only by the research group at the mother ship? How did the results get disseminated to all surgeons so that they could apply the findings to their next trauma laparotomy?
  • Look at the outlier. This is always valuable. Why was center #4 so much lower at the beginning of the study period compared to the one year historical control? Were their laparotomy numbers lower? Patient/injury mix different? Did you interview that group to see what their insights were? This is one of the most interesting findings, in my opinion.

I’ll be sitting in the front row for this one!

Reference: Better understanding the utilization of damage control laparotomy: a multiinstitutional quality improvement project. EAST 2019, Paper #12.

EAST 2019 #1: Predicting Outcome After Brain Injury

Here’s the first abstract I’ll review from the EAST 2019 Annual Assembly in January.

This one comes to us from the University of Arizona system, and specifically from Tucson. The senior author has an interest in traumatic brain injury (TBI) and geriatric trauma, so it’s not surprising to see this abstract that fuses the two. The aim was to create a new tool to predict mortality in patients who had sustained a TBI.

The authors devised a score, the Brain Trauma Outcome Score (BTOS) using three variables: age, injury severity score (ISS), and presence of blood transfusion. Furthermore, this was used to create a Brain Trauma Outcome Score (BTOS), by dividing the BTOS by the GCS. These equations were developed and tested using data sets from two years worth of TQIP data. I know, lots of acronyms, but stay with me. After generating the equations for GTOS and BTOS from one TQIP dataset and testing against another, both of these systems were checked for discriminatory power by generating receiving operator characteristic curves.

The authors found that the tested BTOS was better at predicting mortality than the tested GTOS. They concluded that “BTOS can accurately predict in-hospital mortality in all TBI patients.” Seems like a pretty bold assertion.

Here are some questions for the authors and presenter to consider in advance to help them prepare for audience questions:

  • Be aware that some typos crept into the final copy. When preparing abstracts, try not to use special characters (i.e. +) as they may not be generic enough for the commercial printing software used to prepare final copy. This is similar to avoiding video or links to YouTube videos in slide sets. I was able to figure out what the question marks really were (I think), but make sure the audience does, too.
  • Why did you even think to create this model? Some new “systems” are just wild guesses, and sometimes it’s even possible to find one that appears to have a significant correlation with reality. What was the rationale that prompted you to combine ISS, age, blood, and GCS? Did your clinical experience suggest this? Papers on related prediction systems? Then what?
  • Is validating your test data using other patients from the same dataset legitimate? Shouldn’t they be very similar since they are in the same 2-years of data? This could make the system less accurate when applied to a very different patient cohort.
  • The GCS range studied was very high and narrow. If I read the abstract correctly, the median was 14-ish with a range from 12-15. These are mostly mild TBIs, so why were they dying anyway? And if the formula for GTOS was derived using predominantly mild TBI data, how can it possibly work well for moderate and severe? And I still worry that patients were dying of problems unrelated to TBI.
  • Make sure you clearly explain your methods to the audience. Some are not well versed in ROC curves, and many will not understand the nuances and potential pitfalls of developing and validating numerical systems like this. It’s easy to lose them, so make sure you are clear and concise in your explanations.
  • How do you see a system like this being used in the future? It’s nice to have some appreciation of the practicality, and an assurance that this isn’t just an academic exercise.

I enjoyed the abstract, and look forward to hearing it in person next month!

Reference: The Brain Trauma Outcome Score (BTOS): Estimating mortality after a traumatic brain injury. EAST 2019, Paper #6.

Starting Next Week: EAST 2019!

The 32nd Annual Assembly of the Eastern Association for the Surgery of Trauma (EAST) is just around the corner. The meeting starts January 15 in Austin, TX.

I traditionally choose some of the abstracts to presented that I find particularly interesting. I’ll dissect them here on the blog, and provide suggestions to the authors on how to prepare for questions they might receive from the audience at the meeting.

Starting next Monday, and continuing through the meeting in Mid-January, I’ll be posting one critique per day. Tune in and enjoy!