The Societal Cost of ED Thoracotomy

ED thoracotomy can be a dramatic, life-saving procedure. From the patient’s perspective, there is only an upside to performing it; without it there is 100% mortality. But to trauma professionals, there is considerable downside risk, including accidental injury, disease transmission and wasted resources. What is the societal risk/cost if ED thoracotomy is performed for weak indications?

The trauma group at Sunnybrook in Toronto looked at this question by retrospectively reviewing 121 patients who underwent the procedure over a 17 year period. They looked at appropriateness, resource use and the safety of the trauma professionals involved. They used the following criteria to determine appropriateness:

  • Blunt trauma with an ED arrival time < 5 minutes
  • Penetrating torso injury with an ED arrival time < 15 minutes with signs of life

Most of the patients were young men (avg age 30) with 78% penetrating injury and 22% blunt. About half (51%) underwent thoracotomy for inappropriate indications. The vast majority of inappropriate cases were for penetrating injuries with long transport times. Only 3 of the inappropriate thoracotomies were for blunt trauma, yet 24 of the “appropriate” procedures were done in the face of blunt trauma.

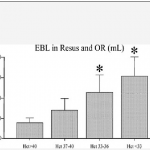
Resource use in the 63 inappropriate cases included 433 lab tests, 14 plain images and 9 CT scans (!!!?), 6 cases in the OR, 244 units of packed red cells and 41 units of plasma. Accidental needlestick injuries occurred in 6% of the inappropriate thoracotomies. None of the patients receiving inappropriate thoracotomy survived.

Bottom line: ED thoracotomy remains a very dangerous procedure. I’ve previously written about guidelines to determine which ones are appropriate (see link below). In this study, many of the procedures were performed on patients with blunt trauma. That means that the number of inappropriate thoracotomies would have been much higher if today’s standards had been applied. So use the guidelines and save your own health, safety and hospital resources. Is it really worth it if you know the patient will not survive?

Related posts:

Reference: Societal costs of inappropriate emergency department thoracotomy. J Amer Col Surg 214(1):18-26, 2012.

CT Scan Images Simplified

Ever wonder what is going on when you drag your mouse across a CT image, or when you change the “window” settings of an image from lung to abdomen? It all has to do with the way CT generated xray information is displayed, and how your eyes and brain perceive it.

Let’s get down to basics. The first thing needed is to understand the concept of radiodensity. The CT scanner uses a set of software algorithms to determine the amount of x-radiation absorbed by every element in a plane of tissue. Each of these elements is represented by a pixel on the video display, and the density (amount of x-radiation absorbed) is measured in Hounsfield units. This scale was developed by Sir Godfrey Hounsfield, who set the radiodensity of water at 0, and air at -1000. The scale extends in the positive direction to about +4000, which represents very dense metals. See the table for the density of common substances on CT.

When you view a CT scan on a video display, two important numbers are displayed on screen. The first is the window width (W), which describes the range of Hounsfield units displayed. The maximum window width possible is usually about 2000, but our eyes are not capable of seeing this many shades. Actually, we can really only distinguish about 16 shades of gray. So the window width is divided by 16, and each group of Hounsfield values is converted to one of 16 shades of gray. The lowest Hounsfield numbers in the window range are shown as black, and the highest are white.

The second important number is the window level (L). This is the Hounsfield number in the center of the window width. So let’s look at some typical examples of W/L settings.

The abdomen contains mostly soft tissue, which is just a little denser than water. So most of the abdominal contents have Hounsfield values from 0 to 100 or so. A typical abdominal scan W/L setting is 350/50. This means that a total range of 350 different densities are displayed, centered on a density of 50 Hounsfield units ( range is -125 to 225 HU). Each difference of 22 HU will show up as a different shade of gray. So this narrow window allows us to distinguish relatively subtle differences in density.

The chest cavities are primarily air-filled, and the lungs are very low density. So it makes sense that a typical lung W/L setting is 1500/-500. The window ranges from -1250 to +250 HU, and a wider range of 94 HU represents one shade of gray. This is typical of body regions with a wider range of densities.

Finally, bone windows are usually 2000/250. This window is centered above the usual tissue densities, and is very wide so that it shows a wide range of densities in only 16 shades of gray. Thus, the contrast appears very low.

On most displays, the window width increases as you drag the mouse to the right. This increases the range of densities in a shade of gray, thus decreasing the overall amount of contrast in the image. Dragging the mouse down decreases the window level, moving it toward the air end of the spectrum. This allows you to center your window on the type of tissue you are interested in viewing and adjust your ability to distinguish objects with a lot or only a little contrast (see table above).

I apologize to my radiology colleagues in advance for this simplistic explanation. Trauma professionals have minimal exposure (pun intended) to the physics and details of radiographic imaging. We are much more interested in effectively using this technology to save our patients’ lives.

Does Initial Hematocrit Predict Shock?

Everything you know is WRONG!

The classic textbook teaching is that trauma patients bleed whole blood. And that if you measure the hematocrit (or hemoglobin) on arrival, it will approximate their baseline value because not enough time has passed for equilibration and hemodilution. As I’ve said before, you’ve got to be willing to question dogma!

The trauma group at Ryder in Miami took a good look at this assumption. They drew initial labs on all patients requiring emergency surgery within 4 hours of presentation to the trauma center. They also estimated blood loss in the resuscitation room and OR and compared it to the initial hematocrit. They also compared the hematocrit to the amount of crystalloid and blood transfused in those areas.

Patients with lower initial hematocrits had significantly higher blood loss and fluid and blood replacement during the initial treatment period. Some of this effect may be due to the fact that blood loss was underestimated, or that prehospital IV fluids diluted the patient’s blood counts. However, this study appears sound and should prompt us to question the “facts” we hear every day.

Bottom line: Starling was right! Fluid shifts occur rapidly, and initial hematocrit or hemoglobin may very well reflect the volume status of patients who are bleeding rapidly. If the blood counts you obtain in the resuscitation room come back low, believe it! You must presume your patient is bleeding to death until proven otherwise.

Reference: Initial hematocrit in trauma: A paradigm shift? J Trauma 72(1):54-60, 2012.

Pet Peeve: “High Index of Suspicion”

How often have you heard this phrase in a talk or seen it in a print article:

“Maintain a high index of suspicion”

What does this mean??? It’s been popping up in our work for at least the last 20 years. And to me, it’s meaningless.

An index is a number, usually mathematically derived in some way. Yet whenever I see or hear this phrase, it doesn’t really apply to anything that is quantifiable. What the author is really referring to is “a high level of suspicion”, not an index. 

This term has become a catch-all to caution the reader or listener to think about a (usually) less common diagnostic possibility. As trauma professionals, we are advised to do this about so many things, it really has become sad and meaningless.

Bottom line: Don’t use this phrase in your presentations or your writing. It’s stupid. And feel free to chide any of your colleagues who do.

Reference: High index of suspicion. Ann Thoracic Surg 64:291-292, 1997.

Blunt Aortic Injury And New Cars

Car crashes are a significant cause of trauma death worldwide. Aortic injury is the cause of death in somewhere between 16% and 35% of these crashes (in the US). Over the years, automobile safety through engineering improvements has been rising. A recent poster presented at EAST 2012 looked at the effect of these improvements on mortality from aortic injury.

The authors analyzed the National Automotive Sampling System – Crashworthiness Data System database (NASS-CDS) for car model years dating from 1994 to 2010. They included any front seat occupants age 16 or more. Over 70,000 cases were reviewed.

Interesting findings:

  • Overall mortality from aortic injury was 89%
  • 75% of deaths occurred prior to arrival at a hospital
  • Risk for suffering an aortic injury was statistically associated with age >=60, being male, being the front seat passenger, position further back from the steering wheel, and ejection from the vehicle
  • The injury was more likely to occur when speed was >= 60mph, impact occurred with a fixed object, and in SUV vs pickup truck crashes
  • Newer cars protected occupants from aortic injury in side-impact crashes, but the incidence actually increased in frontal-impact crashes

Bottom line: Aortic injury will remain a problem as long as we find ways to move faster than we can walk. Engineers will continue to make cars safer, but the increase in aortic injury in frontal impact in late model cars is puzzling. This phenomenon needs further analysis so that safety can be improved further. Trauma professionals need to keep this injury in mind in any high energy mechanism and order a screening chest CT appropriately.

Related posts:

Reference: Aortic injuries in new vehicles. Ryb et al, University of Maryland and Johns Hopkins. Poster presented at EAST Annual Meeting, January 2012.