Tag Archives: mortality

How Fast Do Trauma Patients Die?

For years, I’ve taught my residents participating in trauma activations, “Your patient is bleeding to death until proven otherwise.” This concept served as the basis of the [poorly documented] “Golden Hour” and for decades has directed our efforts at getting patients to a center with an immediately available OR as quickly as possible.

Donald Trunkey published the first paper illustrating the trimodal distribution of death in 1983 in Scientific American. A crude graph showed the large spike in early deaths that occurred within this first hour. But the paper was mainly observational and was not based on quantitative data.

Wouldn’t it be nice to know how quickly these injured patients were dying, and of what? The trauma group at the University of Pennsylvania massaged data in the state trauma database, focusing on patients who died of their injuries during the first four hours. They created two variables to more objectively compare times, the TD5 and the TD50. These are the time at which 5% and the time at which 50% (median) had died, respectively.

The Pennsylvania Trauma Outcomes Study database contains a huge amount of data. During the 11 years of the study, a total of 6,547 met the mortality criteria for analysis.

Here are the factoids:

  • The mechanism of injury was about 60% blunt / 40% penetrating, with an average ISS of 33
  • The majority of these patients (85%) were hypotensive before their death, meaning that they were likely bleeding to death on arrival
  • The  overall TD5 was 23 minutes, and the TD50 was 59 minutes
  • These numbers were shorter for penetrating injuries, TD5=19 minutes and TD50=43 minutes
  • Patients who were not hypotensive lived a little longer: TD5=44 minutes and TD50 = 2 hours 18 minutes
  • 77% of patients died in the ED and 19% in the OR. The remainder died in the ICU.

This chart shows the TD5 by mechanism and type of surgery. This represents when after arrival, patients start dying due to their injuries. Penetrating injury plus hypotension kills the fastest at 19 minutes and head injuries the slowest at 1:20.

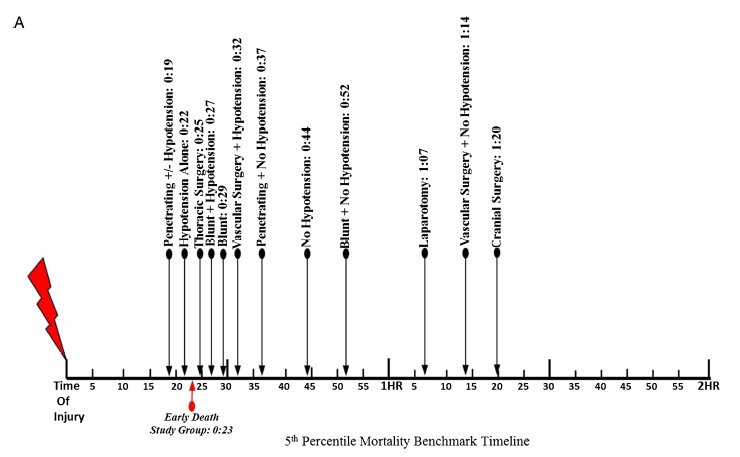
Bottom line: The authors clearly show how soon seriously injured patients start to die. It’s less than 20 minutes in victims of penetrating injury with early hypotension. And the time between the “just start do die” point (TD5) and the “half are dead” point (TD50) is frighteningly short, just an additional twenty minutes!

There appears to be a bit of a grace period in patients who arrive with a normal blood pressure. Their TD50 is extended out to about two hours. All this means is that they are bleeding more slowly, but it is still killing them.

A good rule of thumb is that ANY hypotensive patient should make you justify why you are NOT ALREADY IN THE OPERATING ROOM! Dawdling in the trauma bay or performing unnecessary scans will push your patient much closer to the point of no return. Look at the huger percentage of patients in this study who died in the ED.

Remember, your patient is bleeding to death in front of your eyes, and the only place you can stop it is the OR!

Reference: Defining the optimal time to the operating room may
salvage early trauma deaths, J Trauma 76(5):1251-1258, 2014.

AAST 2019 #5: DOACs Part 2

In my last post, I reviewed a study that scrutinized reversal of direct oral anticoagulants (DOACs), and the outcomes of using various reversal agents. Today I’ll look at an abstract that compared in-hospital outcomes of elderly patients with severe TBI who were taking a variety of anticoagulant drugs, including DOACs.

The group at St. Joseph Mercy Hospital in Ann Arbor reviewed the dataset from the Michigan Trauma Quality Improvement Program database over a seven year period. To be included, patients needed to be at least 65 years old, suffer a fall, and have a significant head injury (AIS > 3). The final data consisted of records from 8312 patients treated at both Level I and II trauma centers across the state.

Here are the factoids:

  • 40% of patients were taking antiplatelet agents, 13% warfarin, 4% DOAC, and the remaining half or so were taking nothing.
  • The head injuries were severe, with mean AIS of 4.
  • After adjusting for “patient factors”, mortality or hospital outcomes were 1.6x more likely when warfarin was used
  • Complication risk increased 1.4x for warfarin and 1.3x for antiplatelet patients, but not for DOACs
  • Hospital length of stay was a day longer in the warfarin group (6.7 days) vs about 5.7 in the others

The authors concluded that elderly patients with severe TBI on DOACs fared better than those on warfarin. They stated that this could help alleviate concerns about DOACs in head trauma patients.

This is yet another interesting and surprising piece of the TBI on anticoagulants puzzle! It is obviously limited due to its retrospective database nature, which prevents us from asking even more interesting questions of this dataset. And it completely prevents us from looking at the specifics of each case including decision making, imaging, etc. But it’s a good start that should prompt us to find even better sources of data to tease out the details we must know in order to improve this patient group’s care.

Here are my questions for the presenter and authors:

  • I am very interested in the “patient factors” that were adjusted for to try to normalize the groups. Please describe in detail the specific ones that were used so we can understand how this influenced your results.
  • This information is intriguing, suggesting that warfarin is more evil that DOACs. What is the next step? What shall we do to further elucidate the problems, and how can we ameliorate the mortality and complication effects?

This is more good stuff about DOACs, and I can’t wait to hear the details.

Nuances Of The “Unanticipated Mortality” Classification

All trauma centers verified by the American College of Surgeons (ACS) are required to classify trauma patient deaths into one of three categories: unanticipated mortality, mortality with opportunity for improvement, or mortality without opportunity for improvement. I’ve provided some details about each of those over the past several posts. But I do want to provide a little more detail for the much dreaded “unanticipated mortality.”

You may have noticed that unanticipated mortality does not seem to come in the same two flavors as the anticipated mortality: with and without opportunity for improvement. Why is this? Does this imply that all unanticipated mortalities have some opportunity or another? I actually used to think so.

But over time, I’ve changed my mind. It is true that the vast majority of unanticipated mortalities involve one, and many times, several opportunities that may improve the outcome for similar patients in the future. But I have personally seen at least two that did not.

How can this be, you say? Let me give you a far-fetched example. A healthy young male is involved in a car crash, sustaining fractures of a few ribs which are very painful. He is admitted for pain control, and is treated with your usual regimen of analgesics, mobilization, and pulmonary toilet. He admits to no significant medical or surgical history and is taking no medications. As he is sitting in his room waiting for his ride on the day of discharge, a small meteorite plunges through his window and strikes him in the head, killing him instantly.

So where’s the opportunity? Put meteorite shielding around your entire hospital? I think not. Don’t be ridiculous, you say, that’s not a realistic example. But what if, on the day of discharge, he stands up in his room and keels over in PEA arrest? An autopsy is performed, and a massive pulmonary embolism is identified. And let’s say that this patient somehow met your DVT prophylaxis criteria and he was receiving appropriate management per your practice guideline. And when you convey these findings to the family, they seem to recall a pattern of pulmonary embolism deaths and DVT complications in other family members. But nobody mentioned this to you during the history and physical exam. And you treated them exactly according to your protocol.

So what do you think now? Is there an opportunity? I still think not! But you must still pick apart every bit of the patient’s care, trying to identify anything that was not done according to plan or protocol that may have led to this (extremely) adverse outcome. But be aware that over your career as a trauma professional, you will likely run into one or more of these cases that are unanticipated but completely nonpreventable!

Trauma Mortality Nomenclature: Part 3

Time to (nearly) finish up this series on trauma mortality! We discussed the two types of anticipated mortality previously, now it’s time for the final (and worst) one.

Old nomenclature: preventable death
New nomenclature: unanticipated mortality

Note the subtle difference. The old name presumes you could have done something about it, which can lead to legal issues in some cases. The new one implies that death was unexpected, but does not presume that it could have been prevented. However, in most cases analysis shows that it could have.

Any unanticipated mortality should launch a full investigation from the trauma performance improvement program. In some cases, hospital quality may need to get involved. A root cause analysis may be indicated, depending on how many factors are involved. These cases must be discussed by the multidisciplinary trauma PI committee, at a minimum. It’s essential that everyone involved do their homework and become familiar with every aspect of care so that a meaningful analysis can occur at the meeting.

Trauma center reviewers will expect to see detailed documentation of the analysis in the PI committee minutes. And unless the death was a complete and unpreventable surprise there should be new protocols, policies and practice changes apparent. If these are not present, expect major reverification issues for your trauma center.

Is there an appropriate ratio of the three types of mortality? Obviously, there is a fair amount of variability. But after years of doing reviews, I can offer some guidelines. Here’s my 100:10:1 rule of thumb:

  • 100 cases – mortality without opportunity for improvement
  • 10 cases – mortality with opportunity for improvement
  • 0-1 case – Unanticipated mortality

If your hospital’s numbers are outliers in any group, your clinical care and performance improvement program will get extra scrutiny. If all your cases are mortalities without OFI, then your PI process is too lax. This is a complex business, and there a many ways to improve our care. If your mortality with OFI cases are too frequent, your threshold for improvement may be set too low (see my previous post). If you have more than 1 or 2 unanticipated mortalities, then there may be some serious care quality issues.

Bottom line: When reviewing trauma mortality, be realistic but brutally honest. We learn from the mistakes we make. But by adhering to the process, you should never make the same mistake twice.

In my next post, I’ll provide some additional thoughts on unanticipated mortality.

Trauma Mortality Nomenclature: Part 2

Yesterday I explained the most commonly assigned type of trauma mortality, mortality without opportunity for improvement (mortality without OFI). Today, I’ll cover the next highlest level.

Old nomenclature: potentially preventable death
New nomenclature: mortality with opportunity for improvement (mortality with OFI)

Again, these sound somewhat similar but they are quite different. Potentially preventable death used to be applied to patients who had obvious care issues that had some potential to change outcome. But it also contained a number of patients discussed yesterday who had support withdrawn due to age or degree of injury. There was some nagging doubt that, it something else had been done, maybe they would have recovered. So several of the “potentially preventable” deaths in the old category have been moved to the “without opportunity for improvement” category.

Unfortunately, a larger group of patients from the nonpreventable death category have moved into the “with opportunity for improvement” category. This is actually a good thing, though. The mortality with OFI category looks at whether there were any care issues, regardless of whether support was eventually withdrawn.

Whereas the vast majority of deaths at any center should fall into the mortality without OFI category, a modest number will be classified as with OFI, about 10%. The actual number depends on how broadly or narrowly an opportunity for improvement is defined. If you consider a few areas of missing documentation on the trauma flow sheet an opportunity for improvement, then you’ll have a lot of deaths classified this way. Concentrate on issues that might have actually had an impact on the outcome. The key is to develop a set of criteria that is realistic and that work for you. If the number of deaths with OFI seems high, go back and look at those criteria and adjust them. You can still work out a system for improving trauma flow documentation without it changing every death in a trauma activation to one with an opportunity for improvement.

Tomorrow, I’ll discuss that most dreaded category, the unanticipated mortality.