Tag Archives: EMS

Uber / Lyft For Medical Transport???

In this day and age of ride sharing apps like Uber and Lyft, it is possible to get a cheap ride virtually anywhere there is car service and a smart phone. And of course, some people have used these services for transportation to the hospital in lieu of an ambulance ride. What might the impact be of ride services on patient transport, for both patient and EMS?

A paper in preparation suggests that ambulance service calls decreased by 7% after the introduction of UberX rides. Now, there are a lot of questions here, because the full paper has not yet been peer reviewed, and the results write-up is pretty sketchy. But it does beg the question.

Ambulance rides are expensive. Depending on region, they may range from $500-$5000. And although insurance may reduce the out of pocket cost, it can still be expensive. So what are the pros vs the cons of using Uber or Lyft for medical transport?

Pros:

  • Ride shares are inexpensive compared to an ambulance ride
  • They may arrive more quickly because they tend to circulate around an area, as opposed to using a fixed base
  • Riders may select their preferred hospital without being overridden by EMS (although it may be an incorrect choice)
  • May reduce EMS usage for low acuity patients

Cons:

  • No professional medical care available during the ride
  • May end up being slower due to lack of lights and siren
  • Damage fees of $250+ for messing up the car

Bottom line: Uber and Lyft are just another version of the “arrival by private vehicle” paradigm. Use of these services relies on the customer/patient having very good judgment and insight into their medical conditions and care needs. And from personal experience, this is not always the case. I would not encourage the general public to use these services for medical transport, and neither do the companies themselves!

Reference: Did UberX Reduce Ambulance Volume? Unpublished paper, October 24, 2017.

Can Prehospital Providers Accurately Estimate Blood Loss? Part 2

I’ve previously written about the difficulties estimating how much blood is on the ground at the trauma scene. In general, EMS providers underestimated blood loss 87% of the time. The experience level of the medic was of no help, and the accuracy actually got worse with larger amounts of blood lost!

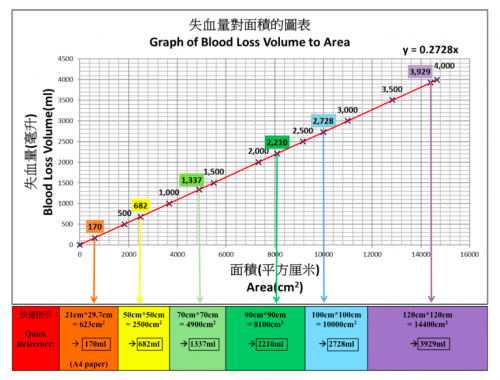
A group in Hong Kong developed a color coded chart (nomogram) to assist with estimation of blood loss at the scene. It translated the area of blood on a non-absorbent surface to the volume lost. A convenience study was designed to judge the accuracy that  could be achieved using the nomogram. Sixty one providers were selected, and estimated the size of four pools of blood, both before and after a 2 minute training session on the nomogram.

Here’s what it looks like:

Note the areas across the bottom. In addition to colored square areas, the orange block is a quick estimate of the size of a piece of paper (A4 size since they’re in Hong Kong!)

Here are the factoids:

  • The 61 subjects had an average of 3 years of experience
  • Four scenarios were presented to each: 180ml, 470ml, 940ml, and 1550ml. These did not correspond exactly to any of the color blocks.
  • Before nomogram use, underestimation of blood loss increased as the pool of blood was larger, similar to the previous study
  • There was a significant increase in accuracy for all 4 scenarios using the nomogram, and underestimation was significantly better for all but the 940ml group
  • Median percentage of error was 43% before nomogram training, vs only 23% after. This was highly significant.

Bottom line: This is a really cool idea, and can make estimation of field blood loss more accurate. All the medic needs to do is know the length of their shoe and the width of their hand in cm. They can then estimate the length and width of the pool of blood and refer to the chart . Extrapolation between colors is very simple, just look at the line. The only drawback I can see occurs when the blood is on an irregular or more absorbent surface (grass, inside of a car). 

Related posts:

Reference:  Improvement of blood loss volume estimation by paramedics using a pictorial nomogram: a developmental study. Injury article in press Oct 2017.

How Long Does It Take EMS To Respond?

How long does it take for EMS to get to the scene of an emergency? That’s a loaded question, because there are many, many factors that can impact this timing. If you look at the existing literature, there are few, if any, articles that have actually looked at this successfully.

A group from Aurora, IL and Wake Forest reviewed EMS records from across the country, spanning 485 agencies over a one year period. Only 911 responses were reviewed, and outliers with arrival times of more than 2 hours and transport times of 3 hours were excluded. Over 1.7 million records were analyzed, and 625 were excluded for this reason.

Here are the factoids:

  • In 71% of cases, the patient was transported to a hospital. In one quarter of cases, they were evaluated but not transported. 1% were dead on arrival, and in 2% no patient was found at the scene (!)
  • 4% of patients were transported in rural zip codes, 88% in suburban ones, and 8% from urban locations
  • Overall response time averaged 7 minutes
  • Median response times were 13 minutes for rural locations, and 6 minutes for both suburban and urban locations
  • Nearly 1 in 10 patients waited 30 minutes for EMS response in rural locations

Bottom line: There is an obvious difference in EMS response times between rural and urban/suburban locations. And there are many potential reasons for this, including a larger geographic area to be covered, volunteer vs paid squads, etc. Many of these factors are difficult, if not impossible to change. The simple fact that it takes longer to reach these patients increases their potential morbidity and mortality. Remember, time is of the essence in trauma. The patient is bleeding to death until proven otherwise. It is far easier and cost-effective to equip bystanders with the skills to assist those in need (basic first aid, CPR, Stop the Bleed, etc) while waiting for EMS to arrive.

EMS: Scoop and Run or Stay and Play for Trauma Care? The Final Answer?

I’ve been discussing the little research there is on stay and play vs scoop and run. And now, hot off the press, we have a paper about the ultimate version of scoop and run, the “drive-by ambulance.” This one looks at outcomes in patients who are dropped at the emergency department by private vehicle. This is the most basic form of prehospital care, with no interventions, just transportation. This type of transport is used by parents with their injured children, police who act as very basic first responders in some cities, and on occasion, gang members.

A multi-institutional group of authors used data in the National Trauma Databank to try to answer this question. They used three years worth of data, comparing outcomes from patients with ground EMS vs private transport who were treated at Level I and Level II trauma centers. Only gunshots and stabs were included, and all patients were 16 or older.  The  authors were focused on only one thing: mortality. This included death in the ED, and a model was developed to adjust risk based on vital signs, injury severity score (ISS), race, and insurance status. Just over 100,000 were included in he final analysis.

Here are the factoids:

  • Black and hispanic patients were more frequently transported by private vehicle, but only by about 3%
  • White patients were more frequently taken by ground EMS, by about 6%
  • Stabs were more likely to be brought by private car than gunshots, 56% vs 44%
  • Mean ISS was significantly higher for those transported by ground EMS (10 vs 5.5)
  • Unadjusted mortality was lower overall for private vehicle, 2% vs 12%
  • The chance of dying in the ED was also decreased in the private transport patients, from 7% to 1%
  • Mortality from both gunshots and stabs were also significantly lower (5% vs 9%, and 0.2% vs 3% respectively)
  • Once adjusted for risk, the lower mortality with private transport remained, with a 60% risk reduction of death. This persisted in the gunshot and stab cohorts as well.

Bottom line: Wow! Although this study has the usual limitations of using a large external database, it was very well designed to compensate for that. And the degree of improvement in survival is surprising. What this study can’t tell us is why. Certainly, some patients benefit from a little extra time to give fluid or blood, intubate, or provide some other treatments. But the patient with penetrating frequently does not need this, they just need definitive control of hemorrhage. The authors even go so far as to suggest that at-risk populations receive education on “scoop and run” if people they know suffer penetrating injury.

The next step is to tease out which components of the stay and play paradigm are the most valuable, and which contribute to the increased mortality in penetrating injury patients.

Reference: Association of Prehospital Mode of Transport With Mortality in Penetrating Trauma A Trauma System–Level Assessment of Private Vehicle Transportation vs Ground Emergency Medical Services. JAMA Surgery, Published online September 20, 2017.

EMS: Scoop and Run or Stay and Play for Trauma Care? Part 3

Scoop and run or stay and play. Is one better that the other? Over my last two posts, I reviewed a couple of papers that were older (6-7 years) and had smaller patient groups. Now let’s look at a more recent one with a larger experience using a state trauma registry.

This one is from the Universities of Pittsburgh and Rochester, and used the Pennsylvania state trauma registry for study material. The authors wanted to really slice and dice the data, postulating that previous studies were not granular enough, such that significant trends could not be seen due to lumping all prehospital time together. They divided prehospital time into three components: response time, scene time, and transport time. To some degree, the first and third components are outside of the prehospital providers’ control.

The records for over 164,000 patients were analyzed. These only included those for patients transported from the scene by EMS, and excluded burns. The prehospital time (PH time) was divided into the three components above. A component was determined to be prolonged if it contributed > 50% of the total PH time.

Here are the factoids:

  • Half of the patients had a prolonged PH time interval (52%)
  • Response time was prolonged in only 2%, scene time was prolonged in 19%, and transport time was longer in 31%
  • Mortality was 21% higher in those with a prolonged scene time component
  • There was no mortality difference in patients with no prolonged time components, or those with prolonged response or transport times
  • These patterns held for both blunt and penetrating injury
  • Extrication and intubation were common reasons for prolonged scene time. Extrication added an average of 4.5 minutes, and intubation 6.5 minutes.
  • Mortality was increased with prehospital intubation, but this effect lessened in severe TBI
  • Increasing experience with extrication and intubation appeared to decrease the mortality from the increased scene time they caused

Bottom line: This paper suggests that the dichotomy of “scoop and run” vs “stay and play” may be too crude, and that a more nuanced approach should be considered. In plain English, the optimal management lies somewhere in between these polar opposites. Actual on scene time appears to be the key interval. EMS providers need to be aware of scene time relative to response and transport times. Patients with specific injury patterns that benefit from short scene times (hypotension, flail, penetrating injury) can quickly be identified and care expedited. Increased scene time due extrication cannot be avoided, but prehospital intubation needs to be considered carefully due to the potential to increase mortality in select patients. 

Reference: Not all prehospital time is equal: Influence of scene time on mortality. J Trauma 81(1):93-100, 2016.