Tag Archives: AAST2020

Best Of AAST #14: Trauma Patient Health Literacy

When is the last time this has happened to you? You are called to the ED for a trauma activation. The patient was involved in a motorcycle crash and is doing fine, but he has a large midline scar on his abdomen. You inquire as to what it is. He tells you that he had been involved in another motorcycle crash about five years ago and needed an operation. When questioned about what his injuries were and what was done, he has no idea.

This is an example of health (il)literacy at its best. An earlier study from the Presley trauma center in Memphis demonstrated that less than half of their trauma patients could correctly recall their injuries or their operations.

This is not really surprising. Have you ever taken a minute to look at the sheaf of paper given to hospital patients when they are discharged? They are usually computer-generated gobbledygook and are not easily understood by any human on this earth. It is hard enough to figure out the discharge medications and followup visits. And any diagnosis or surgical procedure information is never in patient-friendly language.

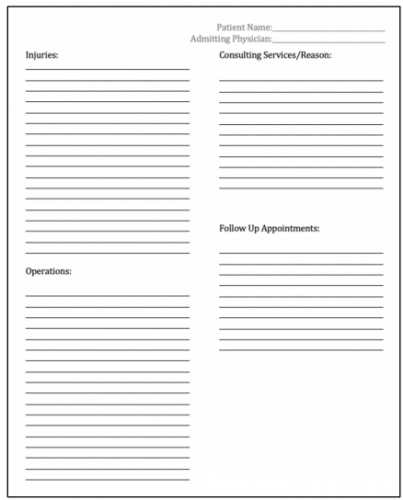
The Memphis group designed a simple discharge information form to provide to their patients:

Here are the factoids:

  • Patients admitted to the trauma service over a 6-month period were studied and surveyed during their first post-discharge clinic visit
  • A total of 153 surveys were distributed, asking about income, education, and patient satisfaction and their understanding of what happened to them; 146 were returned
  • Income levels were low, with about 60% of them less than $25K and 85% less than $50K
  • About 75% had a high school education or less
  • Implementation of the form increased injury recall some or all of patient injuries from 55% to 85%, and recall of operations from 43% to 76%
  • The number of patients who could recall any of their providers’ names increased from 11% to 31% (!)
  • Injury understanding, satisfaction with injury understanding, and the overall impact on hospitalization was significantly positive

The authors concluded that introducing this simple form dramatically improved their patients’ health literacy, and their patients were able to provide more details to providers they visited post-discharge.

Here are my comments: I think the bottom line here is to know your patients! Socioeconomic and education status vary dramatically by geographic location. This certainly has an impact on the understanding and recall of hospital events by our patients. It can help us optimize processes to provide meaningful and important information that they need to know in the future.

The form used in this study was very simple, consisting of a series of blanks to be filled in by a healthcare provider. But who was this provider? All medical professionals tend to use the lingo that we learned in training. But our patients have zero understanding of them. Consider the lowly Foley catheter. Tell a patient you are going to insert one, and they will say “uh-huh.” But tell them that you are preparing to stick a big rubber tube in their penis, and the response will be much more vocal. Make sure the language is simple and lingo-free.

The recall of provider names improved only modestly. This may be due to the typical “interchangeable head” model where the various healthcare professionals change on a frequent bases. Additionally, patients are seen by a horde of nurses, physicians, APPs, residents, techs, and others during their stay so it’s easy to forget a name.

Overall, the results were very promising. This is a significant advance in patient health education and literacy. I think the next step is to provide a library of information sheets based on the common injury diagnoses and operations that occur at the trauma center. This, coupled with a more intelligible set of discharge papers in general will be of great help to our patients.

Here are my questions for the presenter and authors:

  • Why so few surveys? Your center is very busy, and the study data only involved about 25 patients per month. How did you select them, and might information obtained from all the other patients have changed your results?
  • Did you independently review the discharge forms to ensure understandable language? The intelligibility could vary significantly based on the provider filling it out.
  • How did your care model affect the patient recall of their providers? Do your residents or attending surgeons rotate on a frequent basis? What other factors might have influenced this?
  • What next? How has this information changed how you educate your patients now? What additional changes might you make in the future? How will you roll it out to more than just 25 patients per month?

This is excellent work! I’m looking forward to your live presentation later this week.

Best Of AAST #13: Work-Life Balance

Okay, so this abstract is a bit more on the touchy-feely side. But it is extremely important because it speaks to the balancing act we all have to perform in order to achieve a satisfying harmony between work and everything else.

Older generations of surgeons threw nearly all of their energy into work, and ended up with lesser amounts of involvement with their family and everything else outside of work. At the time, , though, people seemed to be (mostly) satisfied. That’s just the way it was.

But now, there is much more emphasis on a healthy lifestyle, and this includes a healthy delineation of work and not-work. An AAST-approved survey was sent to the membership which tried to parse out the various factors involved in work-life balance, happiness, and burnout.

Here are some very interesting factoids:

  • Of more than 1300 questionnaires sent out, only 291 (21%) returned them (wish I had a sad face icon here)
  • Only 43% were satisfied with their work-life balance
  • There was no difference in satisfaction based on age, sex, or practice type
  • Here are the factors that set the satisfied surgeons apart from the dissatisfied:
    • Early (<10 years) or late in career (>20 years)
    • Fewer hours spent at work
    • More hours spent (awake) at home
    • Enjoy their job
    • Enjoy their partners
    • Better at saying no or delegating work tasks
    • Feel they are fairly compensated
    • Engage in hobbies (86% vs 68%)
    • Exercise regularly (49% vs 20%)
    • Eat a healthy diet (74$ vs 48%)
    • Get more sleep (7 hrs vs 6 hrs)
  • Despite getting the same amount of vacation time, the satisfied surgeons actually used it
  • Dissatisfied surgeons reported significantly more feelings of burnout (77% vs 39%)

The authors concluded that trauma programs should concentrate on optimizing the modifiable factors listed above to improve satisfaction and decrease burnout.

Here are my comments: Well, I don’t have many, nor do I have any questions for the authors. This is a purely descriptive study that paints a general picture outlining what seems to be important in enhancing satisfaction with one’s career path. It is an interesting read, and outlines many of the factors that influence this. I’m sure it’s not all of the factors, but they hit the big ones.

All trauma professionals should look at this data and read the final manuscript. It may help you make changes to optimize your own work-life balance and career satisfaction.

Reference: Modifiable factors to improve work-life balance for trauma surgeons. AAST 2020, Oral abstract #50.

Best of AAST #12: Embolization Of Splenic Pseudoaneurysm

The management of blunt spleen injury has evolved significant over the time I’ve been in practice. Initially, the usual formula was:

Spleen injury = splenectomy

This began to change in the late 1980’s, and beginning in the early 90’s nonoperative management became the rage. We spent the next 10-15 years tweaking the details, gradually reducing bed rest and NPO times, and increasing the success rate through smart patient selection and discovering new adjuncts.

One of these adjuncts was angiography with embolization. The ShockTrauma Center in Maryland was an early adopter and protocolized its use in patients with high-grade injuries.

But now, they are questioning the utility of this tool in certain patients: those with splenic pseudoaneurysms (PSA). They theorized that modern, high resolution CT identifies relatively unimportant pseudoaneurysms. They conducted a 5-year retrospective review of their experience.

Here are the factoids:

  • They identified 717 splenic injuries, of whom 155 were embolized but only 140 patients had adequate records and imaging for review
  • The majority of patients had high grade injury: 31% Grade 3, 61% Grade 4, 1% Grade 5
  • Extravasation was seen in 17% and PSA in 52%
  • About 44% of patients went to angiography within 6 hours, but the mean was 17 hours indicating quite a few outliers
  • Among the 73 patients with an initial PSA , a third of them did not have a detectable lesion during angiography
  • Patients who underwent embolization for PSA had a followup CT 48-72 hours afterwards, persistently perfused PSA were seen in 40% (!)
  • No patients with PSA who were only observed required delayed splenectomy

The authors conclude that a third of pseudoaneurysms may be clinically insignificant, and that 40% of them persist after embolization. They do not, however, offer any recommendations based on their data.

Here are my comments: This is an interesting study. My read of the abstract and slides would indicate that this group routinely sends all Grade 3 and 4 injuries to angio, and Grade 5 could go to either angio or OR. They take their good time going to interventional radiology (mean 17 hours from arrival), and get a routine followup CT 48-72 hours from hitting the door if they didn’t go to the OR.

If I were to play the devil’s advocate, I might think that interventional radiology was being de-emphasized for some reason. Was there some reluctance to send patients there, or limited availability? This might explain the long access times. And how are the radiologists not shutting down 40% of PSA that are seen?

I am intrigued by the study, but there are a lot more details needed to get some good takeaways from it.

Here are my questions for the presenter and authors:

  • Please explain why it takes so long to send patients to angiography. Less than half got there in less than 6 hours, and the mean of 17 hours means that many didn’t get there until the next day.
  • Does this small study have the statistical power to say that some PSA are benign? The groups are very small, and I would speculate that the group size needed to show significance is in the high hundreds.
  • What was the reason for splenectomy in the 2 patients who underwent embolization? Was it related to the pseudoaneurysm or something else?
  • How can you be sure that these PSA are insignificant? Frequently, pseudoaneurysms don’t explode for 7-10 days. Do you have any data on patients who returned to a hospital with delayed bleeding?
  • If you believe that many pseudoaneurysms are benign, how do you propose to manage the patients? Observe until they explode? Repeat a contrast CT scan, with the associated contrast and radiation re-dose? And how long would you wait to do this? What would your new protocol be?

I’ll be all ears on Friday when this abstract is presented live.

Best Of AAST #11: Hard Signs Of Vascular injury

The next abstract in this series poses a challenge to long-held dogma. More than three decades ago, examination of vascular injuries was divided into “hard signs” vs “soft signs.” Hard signs consisted of findings like pulsatile hemorrhage, expanding hematoma, absent distal pulses, thrill, or bruit. These were believed to be absolute indications to proceed directly to the operating room for exploration and repair.

But now, in this day and age of CT angiography  (CTA)and all manner of endovascular techniques and tools, things seem to be changing. There is more reliance on CTA, and a willingness to image patients with hard signs before considering an operation. But is this prudent?

The AAST established the Prospective Observational Vascular Injury Treatment (PROOVIT) database as a multi-institutional effort involving major trauma centers around the country in 2013. A group based at the Massachusetts General Hospital massaged the data to study current patterns in assessment and management of patients with penetrating extremity vascular injury. Specifically, they were interested in examining the presence of hard signs and the outcomes after initial imaging and operative management.

Here are the factoids:

  • A total of 1,910 database records were reviewed, of which 1108 (58%) presented with hard signs of injury
  • 83% of the patients with hard signs had either active hemorrhage or expanding hematoma; only 15% had ischemia
  • CTA was used in a quarter of patients with hard signs (24% hemorrhagic, 40% ischemic)
  •  Two thirds of patients with hard signs were taken to OR without imaging (70% hemorrhagic, 45% ischemic)
  • Open repair was performed in about two thirds of hemorrhagic and ischemic patients both with and without imaging, but endovascular  or hybrid repairs were 5x more likely (2% vs 10%) in patients who underwent imaging first
  • There were no differences in outcomes (amputation, mortality, blood transfusions, reoperation) between the open and endovascular/hybrid repair groups

The authors concluded that stable patients with hard signs of vascular injury may benefit from preop imaging to help plan the specific mode of repair to be performed (open vs endovascular / hybrid).

Here are my comments: This was a retrospective review of prospectively collected data. The database has a wealth of detail, and this is a simple and clean analysis of a specific question. The results and analyses were straightforward and easy to follow.

What this study does is to call into question the old dogma of rushing straight to the operating room with any patient who has hard signs of vascular injury. The advent of endovascular tools and techniques has allowed us to more easily address some vascular injuries that were previously problematic due to their location and accessibility.

Being a descriptive study only, it showed us “what we did” with vascular injuries during the time period of the database. And it also showed that the surgeons were more likely to use endovascular techniques if they were able to take the time for preop imaging. Most importantly, it demonstrated that gross outcomes like death, reoperation, and amputation were not increased by the delay needed to obtain that imaging.

I consider this to be a pilot project. And the authors correctly state that the next step is a true prospective study to confirm that this should be the new way of thinking about hard signs in the future.

Here are some questions for the presenter and authors.

  • Please provide more information on the database records used. Which years were included? What were the inclusion criteria? Were any patients excluded?
  • What was the definition of a vascular injury to the extremity? Did it include the very proximal brachial artery or the distal subclavian? These may increase the likelihood of choosing an endovascular repair.
  • Did you stratify by type of penetrating injury (stab vs gunshot) or velocity (assault rifles and shotguns)? These will increase the likelihood of proceeding directly to OR and potentially skew the data.
  • Some data from the abstract is missing, typically p values. This appears to be a glitch with the abstract entry system, since it is a problem in other abstracts as well.
  • How long do you think it will take to collect adequate data from a prospective study so that preop imaging in stable patients becomes the new standard of care?

This was a fun abstract to read! I’m looking forward to the presentation next week.

Best Of AAST #10: The Hybrid ER Room?

The next abstract is an interesting demonstration of the use of technology is trauma resuscitation. Pretty much all technology imaginable. It details the use of a “hybrid ER” room, which combines resuscitation space with all sorts of imaging and even interventional angiographic procedures. Here’s an image of the room when it was first written about in 2012.

A = CT scanner   B = CT exam table   C = movable C-arm   D = monitor screen   E = ultrasound   F = ventilator

This setup was installed at Osaka General Medical Center in Japan nearly 10 years ago. The authors have written occasional papers about it, and have now performed a study on its impact on trauma patient survival. They studied major trauma patients during two time periods. The first was pre-installation (2007-2011), and the second started immediately after installation (2011-2020). They specifically looked at 28-day mortality, and tried to tease out the relation to injury severity.

Here are the factoids:

  • About a thousand patients were studied, 348 in the pre (conventional) group and 702 in the post (hybrid) group
  • 28-day mortality was significantly lower in the hybrid group
  • Using a fancy statistical test (cubic spline analysis), they showed that 28-day mortality sharply decreased 200 days after installation of the hybrid ER
  • Mortality decreased disproportionately more in the hybrid ER as the injury severity score (ISS) increased

The authors concluded that the hybrid ER may have improved survival, especially in the more severely injured patients.

Here are my comments: Hmm. This is an association study that only looks at one variable, the new hybrid ER room. How many other variables may have a potential impact on survival? And how have those variables changed over the past 11 years? I worry that the study premise is too simplistic, but it certainly makes this unique resource look good.

Here are some questions for the presenter and authors:

  • How did you select your patients? You describe about 1,000 patients over 11 years, which is only about 100 per year. What about all the others?
  • What is it about the hybrid room that you think confers such a survival benefit to your patients? It seems to work for all patients, blunt or penetrating, badly hurt or not. What’s the magic?
  • Do you see the same effect for patients who were treated at other hospitals first and then transferred? The extra time that passed could decrease survival in severely injured patients.
  • Please explain cubic spline analysis clearly. I always worry when super-fancy statistical tests are needed to detect a difference. Why was it needed in this case?
  • Why did it take 200 days to see an effect from the installation of the hybrid ER? What happened at that point in time?
  • Please explain how the actual survival is so much better than predicted for ISS=75 patients. Your graph shows an actual survival of about 22%, as opposed to the 3% in your conventional ER. That is a massive improvement! How do you do it?

As you can see, I’m a bit uncertain about how this works and how the lessons can be applied to other centers. This is a unique resource, and the rest of the world needs to know a lot more about it before deciding to try it out themselves.