Category Archives: Trauma Systems

Radiographic Image Sharing Systems

There are generally three ways to share radiographic images with your upstream trauma center:

  • Hard copy. These days, that usually means a CD. Nearly all PACS systems (picture archiving and communications systems) can write CDs that can accompany your patient. Advantage: super cheap. Possible downsides: the CD may be corrupted and not openable, the software on the disk cannot be installed or will not run at the receiving hospital, and finally it can just be forgotten in the rush to get the patient out of the ED.
  • PACS system connections. These are software links that enable one hospital’s PACS software to communicate with another’s. They must be established in advance, and generally require some expertise from the hospitals’ IT departments. Images can be pushed from one system to another. Advantages: once set up, it is very inexpensive to maintain, and images can be viewed prior to patient arrival at the receiving hospital. Possible downside: Al-though the interchange format is standardized, every once in a while the systems just can’t communicate.
  • Web-based image sharing system. This consists of a web server-based software application available via the internet that allows subscribing hospitals to sign on and share images. Referring hospitals can upload images from their PACS systems for free, and the receiving hospital can view the images and/or download into their own system. Advantage: these products are simple to set up, and easy to use after just a little training. Compatibility is very high, and the services are continually working to ensure it. Downside: expensive. Depending on specifics, the annual subscription may be up to $100K per year, and is generally footed by the receiving trauma center.

Is a web-based solution worth it? MetroHealth in Cleveland looked at this over five years ago, and published their results in 2015. They looked at their experience pre- and post-implementation and found the following:

  • Three years of transfer data prior to the web system implementation was compared to one year of experience after
  • CT imaging decreased at both referring and receiving hospitals across the study period
  • Repeat scan rate decreased from 38% to 28%. Repeat head scans were the major driver at 21%.
  • Cost of reimaging dropped from about $1000 per patient to $600

Bottom line: As a referring hospital, it is your responsibility to ensure that the (hopefully) few images you obtain make it to the upstream trauma center. Although hard copy (CD) is the cheapest, it is also the least reliable. Work with your radiology and IT departments to determine which electronic solution is best for you. Some states and regional trauma systems help subsidize or provide a web-based solution for their member hospitals.

Reference: Implementation of an image sharing system significantly reduced repeat computed tomographic imaging in a regional trauma system. J Trauma 80(1):51-56, 2016.

Impact Of Patient Imaging Prior To Transfer Out

The reality is that 90% of injuries are minor and can be treated at any hospital. A minority of patients actually have issues that require transfer to a higher-level trauma center. Physical examination can certainly help determine who some of those patients are. Think obvious open fracture or severe brain injury at a hospital without key specialists to care for them.

But not all injuries are that obvious. Imaging techniques are the next step to identifying injuries that would require transfer. The question is, how much imaging is appropriate?

A few hospitals are selective about it. But many proceed with a comprehensive battery of scans and x-rays. Some believe that their receiving trauma center expects it. And a few may be doing it for the money, unfortunately. So who is right?

There are three issues at play: time, accuracy, and radiation exposure. Let’s pick them apart.

Time. It takes time to get radiographic studies. Depending on the number obtained, it can take up to 90 minutes. A study looking at transfers from rural hospitals to a regional trauma center in Wisconsin found that the median time to transfer significantly in-creased from 67 to 140 minutes with the addition of even a single CT scan.

This issue appears to be even more of a problem in children. A group at Cincinnati Children’s Hospital studied the characteristics of children who experienced prolonged transfer times to a Level I pediatric trauma center. They reviewed 5 years of registry data, looking at time of injury to time of arrival at their center. The State of Ohio has a goal of a maximum 2-hour transfer time.

And here are the factoids:

  • 748 patients were included in the study, and the demographics were predictable (65%male, 97% blunt)
  • 25% were more severely injured (ISS > 15)
  • The majority of the patients (82%) arrived well after the 2-hour goal (7 hrs!!)
  • 79% of patients with high ISS and 47% of those with severe TBI arrived late (!!)
  • Transfer tardiness did not correlate with distance, and was only slightly improved when a helicopter was used
  • Significantly more CT scans were obtained in the late transfer group (49% vs 23%), and appeared to have no correlation with GCS or vital signs. There was, however, a significant correlation with private insurance.
  • Half of the children with scans arrived without results or had suboptimal imaging, resulting in repeat scans in about one third.

Accuracy and radiation exposure. These two factors are inextricably linked because inaccuracy begets additional imaging. As noted in the previous study, radiology results are frequently lacking, or the studies are not done well, as determined by the receiving center. This means that inaccurate results, or no results at all, are available after transfer. How much of a problem is this?

The Level I center at UC Davis looked at all incoming trauma transfers that had any CT imaging done prior. Of 370 patients, one quarter needed repeat scans. Most common were head scans (47%) and cervical spine (20%). The most common reasons for repetition were referring hospital scan not available (42%) (not sent, couldn’t open) and insufficient quality (20%). This resulted in significant additional radiation exposure, with 4% of patients receiving more than 10mSv!

Bottom line: Imaging prior to transfer definitely increases time to transfer and frequently results in repeat imaging and more radiation exposure. So why does it happen? Sometimes, it’s the mistaken belief that it will save time after transfer. Not the case. Or there is time left before the transport ambulance or helicopter arrives, so why not use it? Not a good reason, and it may delay the transfer team if they arrive early. Or the receiving trauma center “expects it.” Not if they’ve looked at any of these papers!

The best approach is to order only images that will guide your therapy. A chest x-ray on arrival or after intubation. A pelvic x-ray to determine if a binder should be applied. A CT of the abdomen to see if there are any injuries that can’t be taken care of at your hospital. As a general rule, once you have found an injury your hospital can’t treat, or have made the decision to transfer for any other reason, no additional imaging is indicated! 

References:

  • Consequences of increased use of computed tomography imaging for trauma patients in rural referring hospitals prior to transfer to a regional trauma centre. Injury 45:835-839, 2014.
  • Unnecessary imaging, not hospital distance, or transportation mode impacts delays in the transfer of injured children. Pediatric Emerg Care 26(7):481-486, 2010.
  • Rate and Reasons for Repeat CT Scanning in Transferred Trauma Patients. Am Surg 83(5):465-569, 2017.

Trauma And The Electronic Health Record

I’m going to dedicate this week to discussing the impact of the electronic health record (EHR) on trauma care.

First, I’ll talk a little about the history of the EHR, how it came about and why it was “encouraged” of all hospitals. I’ll also look at who the big players are. Next, I’ll review two studies of the impact of the EHR on ED productivity and patient stay.

And finally, I’ll really dig into using an electronic trauma flow sheet that interfaces with the EHR. My thinking has slowly been changing, but not by much. I’ll review my reasons, and talk about the (few) success stories that are out there.

Stay tuned!

Are State Trauma Systems Cost-Effective?

Every state in the US now has a formal trauma system. Several studies are available that document the advantages of these systems in terms of outcomes and survival. Trauma professionals get this. But the governmental agencies and legislators who help create, fund, and maintain them tend to focus on cost as well.

Arkansas was the last state in the union to implement a trauma system. A study in press from the University of Arkansas details their experience. They examined the impact of the new system on mortality, patient care, and attempted to calculate a return on investment from the taxpayers in an effort to show the added value.

The study was commissioned by the Arkansas Department of Health and carried out by the state Trauma Advisory Council. It was led by out of state investigators in an effort to maintain impartiality. A comprehensive review of records was performed by a panel of 5 surgeons, 1 emergency physician, 2 trauma program managers, 1 ground and 1 flight paramedic. Preventable and potentially preventable deaths were identified and analyzed in depth. Value of life lost was calculated by using a conservative $100,000 per year lost. A total of 290 charts were reviewed pre-system, and 382 post-trauma system implementation using proportional sampling of about 2500 trauma deaths in one year.

Here are the factoids:

  • A significantly higher percentage of patients were triaged to Level I trauma centers after the system was implemented
  • Preventable mortality was decreased from 30% to 14% (!!)
  • This means that 79 extra lives were saved due to implementation of the trauma system
  • Non-preventable deaths with opportunity for improvement remained constant at about 55%
  • Non-preventable deaths without opportunity for improvement increased from 16% to 38% (!)
  • Using the most conservative VLL calculation, this equates to $2.4M in savings per life saved
  • This adds up to $186M in savings to the taxpayers of Arkansas, a 9-fold return on their investment of $20M in the trauma system. 

Bottom line: Wow! This nicely done studies gives us excellent insight into the hows and whys of the value of an organized state trauma system. It is likely that the triage system directed more patients to the most appropriate level of care, leading to fewer preventable deaths. And it enticed hospitals to up their game and make the move toward formal trauma center designation. This improved education and training at those centers, leading to better patient care.

There is a wealth of information in this study, and I recommend that everyone with an interest in or are already participating in their state trauma system read it in its entirety. Hospitals that are reluctant to join or are lagging in meeting criteria need to recognize that they are not serving their communities as well as they think. And legislators must realize that the financial impact of even a small investment has real and significant consequences to their constituents.

Related posts:

Reference: Does the Institution of a Statewide Trauma
System Reduce Preventable Mortality and Yield
a Positive Return on Investment for Taxpayers? JACS in press, 2017.

EAST 2017 #9: Geographic Location and Fatal Car Crashes

Trauma resources (centers and helicopter services) are not geographically evenly distributed across the US. The East and West coasts are saturated with resources, maybe overly so. At the other extreme, some northern states (Alaska and the north central US) have very few trauma resources, and injured patients may have to travel several hundreds of miles to get definitive trauma care.

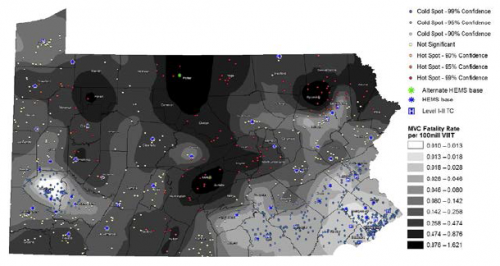
The group at the University of Pittsburgh looked at trauma resource distribution across the state of Pennsylvania, and matched that with geographical data from fatal car crashes over a two  year period. They used some special statistical tools to analyze this type of data, and reported their findings in a format that will be unfamiliar to many: fatalities per 100 million vehicle miles traveled (VMT).

Here are the factoids:

  • 863 fatal crashes occurred during the study period, killing 884 people
  • The median fatality rate for the state was .187 per 100 million VMT
  • Fatality hotspots became very apparent in areas farther from trauma system resources (TSR) (see map below, dark areas are bad)
  • The fatality rate increased significantly by 0.01 per 100 million VMT for each mile farther away from any TSR.
  • If just 2 helicopters had been relocated from trauma centers to high fatality regions, the overall fatality rate could have been reduced by 12%, in theory

Bottom line: This novel way of looking at injury data confirms what we all knew or suspected: injuries occurring farther away from trauma resources may lead to higher mortality and disability. And knowledge is power. If we can see it, we can do something about it. This type of analysis should be done on regional, state, and national levels to help us better serve our patients.

Questions and comments for the authors/presenters:

  1. Be able to describe your statistics simply
  2. How did you deal with data from the border areas of the state? Did you include trauma resources from adjacent states in your analysis?
  3. You mention “county-level” factors in adjusting mortality rates for distance. What were these?
  4. This is a novel way of approaching system planning. Nice job!

Click here to go the the EAST 2017 page to see comments on other abstracts.

Related post:

Reference: Distance matters: effect of geographic trauma system resource organization on fatal motor vehicle collisions. Paper #3, EAST 2017.