Category Archives: Complications

The Tertiary Survey for Trauma: The Basics

After a recent request, I’m re-posting a three part series on the trauma tertiary survey. Today, I’ll cover the basics. In the next two posts I’ll dig into how well it works and who can do it.

Major trauma victims are evaluated by a team to rapidly identify life and limb threatening injuries. This is accomplished during the primary and secondary surveys done in the ED. The ATLS course states that it is more important for the team to identify that the patient has a problem (e.g. significant abdominal pain) than the exact diagnosis (spleen laceration). However, once the patient is ready for admission to the trauma center, it is desirable to know all the diagnoses.

This is harder than it sounds. Physical examination tends to direct diagnostic testing, and some patients may not be feeling pain, or be awake enough to complain of it. Injuries that are painful enough may distract the patient’s attention away from other significant injuries. Overall, somewhere between 7-13% of patients have injuries that are missed during the initial evaluation.

A well-designed tertiary survey helps identify these occult injuries before they are truly “missed.” This survey consists of a structured and comprehensive re-examination that takes place within 48-72 hours, and includes a review of every diagnostic study performed. Ideally, it should be carried out by two people: one familiar with the patient, and the other not. It is desirable that the examiners have some experience with trauma (sorry, medical students).

Why 48-72 hours? Why not just do it when the patient leaves the ED, or when they arrive on the floor? Many occult injuries take time to show themselves. Swelling or bruising takes many hours to become obvious. And the patient may have distracting injuries and just won’t notice a sore finger or wrist that early.

And you can’t wait too long either! Otherwise the issue becomes a clearly delayed injury. A best practice is to require the tertiary survey be done within a specific window (24-48 hours, 48-72 hours, whatever works for your trauma team. Any injuries found in that time interval are not delayed diagnoses, since this process is designed to identify those pesky injuries. Any found after the time interval expires must go through a formal PI review at the primary and/or secondary levels.

The patients at highest risk for a missed injury are those with severe injuries (ISS>15) and/or impaired mental status (GCS<15). These patients are more likely to be unable to participate in their exam, so a few injuries may still go undetected despite a good exam.

I recommend that any patient who triggers a trauma team activation should receive a tertiary survey. Those who have an ISS>15 should also undergo the survey. Good documentation is essential, so an easy to use form should be used. Click here to get a copy of our original paper form. We have changed over to an electronic record, and have created a dot phrase template, which you can download here.

In my next post: Does the tertiary survey actually work?

Best Of EAST #17: Artificial Intelligence vs TRISS

The TRISS score is the great grand-daddy of probability of survival prediction in trauma, first introduced in 1981. It is a somewhat complicated equation that takes the injury severity score (ISS), revised trauma score (RTS), and age and cranks out a probability between 0 and 100%. Over the years, this system has been well validated, and its shortcomings have been elucidated as well.

Many authors have attempted to develop a system that is better than TRISS. Years ago, there was the New-TRISS. And back in the day (early 1990s) I even developed a neural network to replace TRISS. In general, all of these systems may improve accuracy by a few percent. But it has never been enough to prompt us to ditch the original system.

The group at the University of California at Los Angeles developed a machine learning algorithm using ICD-10 anatomic codes and a number of physiologic variables to try to improve upon the original TRISS score. They analyzed three years of NTDB data and attempted to predict in-hospital survival.

Here are the factoids:

  • The authors used over 1.4 million records to develop their model
  • Overall, 97% of patients survived, and survivors tended to be younger, have higher blood pressure, and have sustained a blunt mechanism (no surprises here at all)
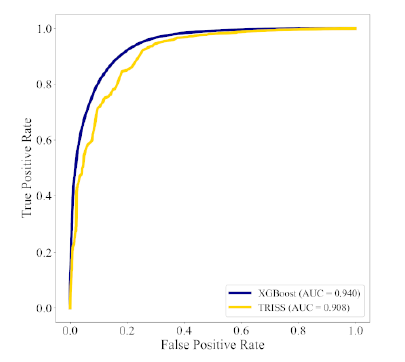
  • The ROC C-statistic for the false positive rate was better with the machine learning model (0.940 vs 0.908), as was the calibration statistic (0.997 vs 0.814)

Here is the ROC curve for machine (blue) vs TRISS (yellow):

The authors conclude that the machine learning model performs better than TRISS and that it may improve stratification of injury.

Bottom line: This study is one of many attempting to improve upon good old TRISS probability of survival. Why have there been so many attempts, and none that have appeared to “stick?” Here are my thoughts:

  • They are complicated. Sure, the original TRISS equation is slightly complicated, but it’s nothing close to a machine AI algorithm.
  • The inner workings are opaque. It’s not very easy to “open the box” and see which variables are actually driving the survival calculations.
  • The results are only as good as the training data. There is a real skew toward survival here (97%), so the algorithm will more likely be right in guessing that the patients will survive.
  • The improvements in these systems are generally incremental. In this case the ROC value increases from .908 to .940. Both of these values are very good.

In general, any time a new and better algorithm is introduced that shows much promise, someone wants to patent it so they can monetize the work.  Obviously, I don’t know anything about the plans for this algorithm. Somehow I doubt that many centers would be willing to abandon TRISS for an incremental improvement that may not be clinically significant at any price.

Here are my questions for the authors and presenter:

  • Please detail how you selected the variables to enter into the machine learning algorithm. Were they chosen by biased humans who had some idea they might be important, or did the AI comb the data and try to find the best correlations?
  • Be sure to explain the ROC and calibration statistics well. Most of the audience will be unfamiliar.
  • Are you using your model in your own performance improvement program now? If so, how is it helping you? If not, why?

Fascinating paper! Let’s here more about it!

Reference: ICD-10-BASED MACHINE LEARNING MODELS OUTPERFORM THE TRAUMA AND INJURY SEVERITY SCORE (TRISS) IN SURVIVAL PREDICTION, EAST 35th ASA, oral abstract #38.

Best Of EAST #13: Whole Blood And Hypocalcemia

Hypocalcemia has long been known to exacerbate coagulopathy. Calcium is involved at several points in the coagulation cascade. Once serum levels drop below about 0.25 mmol/L (normal value 1.2-1.4 mmol/L) thrombin generation and clot formation cease. Although levels this low are probably rare, anything between this low and the normal level can significantly lower clot strength.

Trauma patients are more likely to have bleeding issues than most, and trauma professionals do their best to avoid coagulopathy. Unfortunately, the products we use to replace shed blood are preserved with citrate, which binds calcium. Given in even modest to large quantities, transfusion itself can lead to hypocalcemia.

Most blood transfused in the US has been broken down into separate components (packed cells (PRBC), plasma, platelets) and the effect on calcium levels is well known. The trauma group at Oregon Health Sciences University studied the impact on calcium of whole blood transfusions.

They performed a retrospective review of data collected prospectively over a 2.5 year period on patients receiving whole blood. This included the number of transfusions, ionized calcium levels, and calcium replacements administered. Patients were divided into two groups, those who received whole blood only and those who were given whole blood and component therapy. Outcomes evaluated were ionized calcium levels, hypocalcemia correction, and death.

Here are the factoids:

  • During the study period, 335 patients received whole blood, but only 67% met inclusion criteria
  • About half (103) received a median of 2 units of whole blood (only!)
  • The authors do not state how many component units the whole blood plus component therapy group received
  • There was no difference in calcium levels based on average ISS in the two groups, although ISS does not differentiate injuries that bleed very well
  • Hypocalcemia occurred in only 4% of whole blood patients vs 15% of whole blood + components, which was significant
  • Hypocalcemia within the first hour was significantly associated with death in the first 24 hours and 30 days, although the standard deviation or SEM of this value was large
  • Whole blood only patients received less calcium replacement, and failure to correct was associated with 24 hour mortality
  • Median time to death in patients that “failed to correct” was 7.5 hours after admission

The authors conclude that hypocalcemia rarely occurs in whole blood only resuscitation, and that adding components increases its incidence and overall mortality. They state that aggressive calcium supplementation should be prioritized if component therapy is used.

Bottom line: There’s a lot to “unpack” here! Packed red cells are preserved with 3g of citrate per unit, whereas whole blood units contain only half that amount (1.66g to be exact). One would expect that one unit of packed cells would have twice the anticoagulant effect as a unit of whole blood.

This study is a blended model, where every patient got some whole blood, but some got components as well. Why? Is there a blood refrigerator in the ED stocked with whole blood, and when it is exhausted there is a switch to components? This model makes it more difficult to tease out the impact of the components given. Perhaps it could be done by matching patients with a given amount of whole blood. That is, comparing patients with 3 whole blood with those who received 3 whole blood + 2 PRBC.

There was no room in the abstract to explain why one third of patients were excluded from the study. This needs to be provided to ensure that the remaining two thirds are representative and can legitimately be analyzed. 

The number of units of whole blood per patient was low, with a median of two units given. Is it surprising that these patients did better than ones who received many more? Remember, from a citrate anticoagulant perspective, hanging two units of whole blood is the same as giving just one unit of PRBC.

This abstract raises a lot of questions, and the most important ones deal with how it was designed and the exact numbers of product given. Only then can we be confident that the rest of the associations described are significant.

Here are my questions for the authors and presenter:

  • Why did you choose the whole blood vs whole blood + components for your study? Wouldn’t it have been cleaner to do whole blood only vs components only? Perhaps all of your patients get whole blood? It seems like this might make the results more difficult to tease out.
  • How is whole blood made available for your trauma patients, and did this have an impact on your study? Do you have a limited number beyond which component therapy is used?
  • What were the inclusion criteria? These were not stated in the abstract, but a third of patients were excluded from the study based on them.
  • Could excluding a third of patients have skewed your results, and how?
  • How many component units were given along with the whole blood in the combination group? This was not provided in the abstract and will have a major impact on outcomes if the median total product numbers are significantly higher.
  • What does “failed to correct” mean? Were the patients not responding to large amounts of administered calcium, or were they not receiving large amounts of it?

I am very interested in the fine details in this abstract and will be listening intently to the presentation!

Reference: WHOLE BLOOD RESUSCITATION IN TRAUMA REGULATES CALCIUM HOMEOSTASIS AND MINIMIZES SEVERE HYPOCALCEMIA SEEN WITH COMPONENT THERAPY. EAST 35th ASA, oral abstract #6.

Best Of EAST #12: The Lasting Effect Of Trauma

Trauma professionals are keenly aware of the impact of traumatic injury on their patients. And they are particularly aware of the impact during their own phase of care. Prehospital providers know everything about the situation on scene and in their rig. Inpatient providers are experts in the trauma team activation process and other facets of inpatient care. Physiatrists excel at helping their patients overcome the immediate effects of injury.

But what happens later, three or six or more months down the road? A huge amount of data is collected during the acute care processes and maintained in local or national registries. But once the patient leaves the hospital, there is much less information available about long-term progress and outcomes.

The trauma group at the University of Pennsylvania examined longer-term physical, emotional, and social outcome information on their own patients over a two year period. They administered a set of test instruments and screens, including substance use, employment, living situation, PTSD, and PROMIS-29, a comprehensive evaluation of pain and seven health domains. This battery was given on admission, and then six months after discharge.

Here are the factoids:

  • A total of 618 patients underwent the initial screen, and 129 (21%) completed the six-month followup
  • Demographics of the pre- and post-followup groups were nearly identical
  • The incidence of penetrating trauma was high, about 25%
  • Half of patients had been previously hospitalized for an injury
  • There were statistically significant decreases in the ability to participate in social roles and activities, and a significant increase in anxiety and depression
  • PTSD was common, occurring in 28% of patients
  • Patients reporting only occasional employment or unemployment increased from 45% to 68%

The authors concluded that effects of injury extend beyond the initial pain and disability, impacting several areas for at least six months post-injury. They suggest that there is a need for screening and intervention protocols for post-injury patients.

Bottom line: This is an intriguing paper that focuses attention beyond the areas where most clinicians are aware. It points out the longer lasting impact from trauma, which may have a significant effect on the rest of the patient’s life. Any issues relating to mental or emotional health, or employment and livelihood may have a far ranging impact on that person’s life.

The sample size is small, and the attrition between initial interview and six month followup resulted in an even smaller analysis group. However, the similar demographics imply that the sample is reasonably valid. The screening tools were selected appropriately, and the statistical analyses seem to be appropriate.

This abstract points out the need to look beyond discharge to really find out how our patients are doing. We will probably not like what we see, and it should prompt us to develop more robust screening to figure out who is in trouble. Ultimately, this should move us to incorporate screening and appropriate interventions into the bigger trauma care picture, just as the authors suggest.

Here are my questions for the authors and presenter:

  • Are you confident that your data is representative of your patients given the steep attrition between admission and six month followup?
  • Can your results be generalized to other non-urban trauma patients? The number of patients suffering penetrating trauma or previously hospitalized for injury is very high. Might this group of patients suffer a disproportionately higher likelihood of disturbances at six months?
  • Although your screening test changes are statistically significant, are they clinically relevant? I have seen many numerically different results in other studies that have only questionable clinical significance (e.g. a decrease in ICU length length of stay of 0.4 days).
  • Has your work prompted you to design and implement the type of screening and interventions you are presenting?

This is important work, and will serve to increase awareness of the non-anatomic issues we absolutely must address in order to get our patients back to being healthy again.

Reference: BEYOND PAIN AND DISABILITY: THE LASTING EFFECTS OF TRAUMA ON LIFE AFTER INJURY. EAST 35th ASA, oral abstract #7.

Best Of EAST #8: Timing Of Reimaging For BCVI

There are still many questions regarding optimal management of blunt carotid and vertebral arterial injury (BCVI). We know that they may ultimately result in a stroke. And we kind of know how to manage them to try to avoid this. We also know that the grade may change over time, and many vascular surgeons recommend re-imaging at some point.

But when? There are still many questions. A multi-center trial has been collecting observational data on this issue since 2018. The group reviewed three years of data to examine imaging characteristics and stroke rate during the study period.

Here are the factoids:

  • A total of 739 cases were identified at 16 trauma centers
  • The median number of imaging studies was 2, with a range of 1-9 (!). Two thirds received only one study.
  • Injury grade distribution was as follows:
    • Grade 1 – 42%
    • Grade 2 – 30%
    • Grade 3 – 10%
    • Grade 4 – 18%
    • Grade 5 – <1%
  • About 30% changed in grade during the hospitalization, with 7% increasing and 24% decreasing.
  • Average time to change in grade was 7 days
  • Nearly 75% of those that decreased actually resolved. All of the grade 1 lesions resolved.
  • Stroke tended to occur after about one day after admission, although the grade 1 lesions took longer at 4 days
  • Strokes occurred much earlier than grade change

The authors concluded that there should be further investigation about the utility of serial imaging for stroke prevention.

Bottom line: This is basically a “how we did it” study to tease out data on imaging and stroke after BCVI. It’s clear that there is no consensus across trauma centers regarding if and when repeat imaging is done. And it’s not really possible to make any recommendations about repeat imaging based on this study.

However, it does uncover one important fact. It takes a week for the injury grade on CT to change, but strokes occur much earlier and usually within 24 hours! This is important because it makes it clear that it’s crucial to actually make the diagnosis early. Average stroke occurrence was 9% overall. Grade 1 injuries had only a 3% rate, but grades 2-4 were in the 12-15% range. Grade 5 had a 50% stroke rate!

These facts reinforce the importance of identifying as many of these BCVI as possible during the initial evaluation. The abstract I reviewed yesterday confirmed that the existing screening criteria (Memphis, Denver) will miss too many. More liberal imaging is probably indicated. If you missed the post, click here to view it in a new window.

Here are my comments for the authors and presenter:

  • The “change in BCVI grade over time” charts in the abstract are not readable. Please provide clear images during your presentation and explain what they mean. I was confused!
  • Based on your data, do you have any recommendations regarding the utility of re-imaging? Is it necessary in the same hospitalization at all? These patients will receive treatment anyway, and it doesn’t appear to have any impact on stroke rate.
  • Do you have any recommendations regarding the (f)utility of existing screening systems given the early occurrences of stroke in the study? Are you a fan of using energy / mechanism rather than a bullet list of criteria?

This is important work and I can’t wait to look at the data up close.

Reference: BLUNT CEREBROVASCULAR INJURIES: TIMING OF CHANGES TO INJURY GRADE AND STROKE FORMATION ON SERIAL IMAGING FROM AN EAST MULTI-INSTITUTIONAL TRIAL. EAST 35th ASA, oral abstract #34.