All posts by The Trauma Pro

A Simple Tool To Predict The Need To Operate On A Subdural Hematoma

Trauma centers in the US are seeing lots of elderly patients, and falls are a major mechanism in the patient group. A significant number sustain a traumatic brain injury. Extra-axial bleeding is fairly common, but because of the increased space available inside the skull, the patient may not become overtly symptomatic. 

So what objective criteria can be used to determine if evacuation of a subdural hematoma (SDH)is needed? A study from the University of Manchester in the UK sought to figure this out. They speculated that the size of the lesion and the amount of displacement it caused might be objective enough. So they set out to see if any specific numbers would provide a reliable method.

Here are the factoids:

  • Two neurosurgeons reviewed four years of head CT scans and determined if they should be treated surgically or nonsurgically.
  • Measurements of the maximum thickness of the lesion, its volume, and the degree of midline shift were taken.
  • Reasonable attempts were made to ensure inter-rater reliability.
  • The total pool of scans studied was 483. 44% were judged to need surgical management.
  • Maximum SDH thickness of 10mm or more, or a midline shift of 1mm or more were found to accurately predict 100% of surgical lesions.
  • The best predictor of the need for surgery was midline shift.
  • Adding hematoma thickness did not significantly improve the ROC curve.

Bottom line: This study is somewhat limited because it is the experience of only one hospital, and the number of clinicians involved in decision making is small. It does echo other similar studies, but in my opinion it omits the use of the mental status exam.

Using a lesion thickness of 10mm or shift of 1mm does not necessarily mean the patient needs surgery if there mental status is completely normal. But these criteria can certainly identify a subset of patients who are at risk, and should be monitored very carefully for any deterioration. A change in GCS by even a single point should then send them straight to OR.

Related posts:

Reference: A simple tool to identify elderly patients with a surgically important acute subdural haematoma. Injury 46(1):76-79, 2015.

What Is: A Morel-Lavallee Lesion?

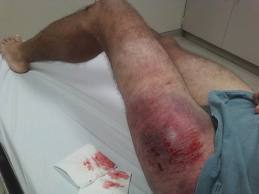
Anyone who takes care of blunt trauma has seen the Morel-Lavallee lesion (M-L). Here’s an obvious one because it’s acute:

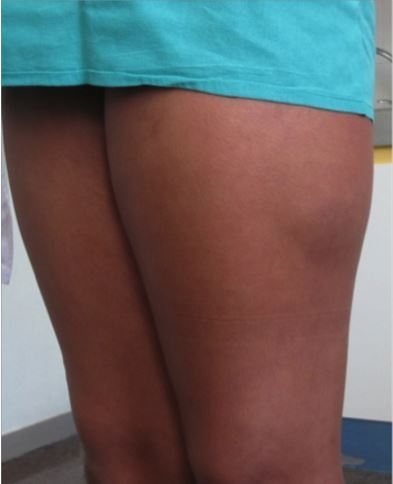
The M-L lesion is essentially a closed degloving injury in which the skin remains intact. The subcutaneous tissue is sheared off of the underlying fascia, and typically blood accumulates in the potential space that is created. This picture shows a less acute lesion; the bruising and ecchymosis on the surface have resolved. Note the collection on the lateral thigh:

These injuries may take a very long time to resolve and may leave some residual deformity. The definitive management has never been very clear: needle drainage vs incision, timing, compression wraps, etc.

The Mayo Clinic reviewed their 8 year experience with 87 of these lesions to try to shed some light on proper management. They treated their patients in four different ways: needle drainage, incision and drainage, compression wraps, and debridement with vacuum drainage devices. Here are the factoids from their study:

  • Motor vehicle crash was the most common etiology for this lesion, which makes sense due to the energy needed to shear the tissues
  • The most common locations were thigh, hip and flank
  • The incidence of pre-existing conditions that might influence outcome (diabetes, obesity, smoking history, use of anticoagulants) did not seem to influence outcomes
  • Lesion location did not change the recurrence rate (even over joints)
  • Aspiration suffered the highest recurrence rate (56%) vs only 15-19% in the other groups
  • Aspiration of more than 50cc of fluid was more common in lesions that recurred (83%) vs those that did not (33%)

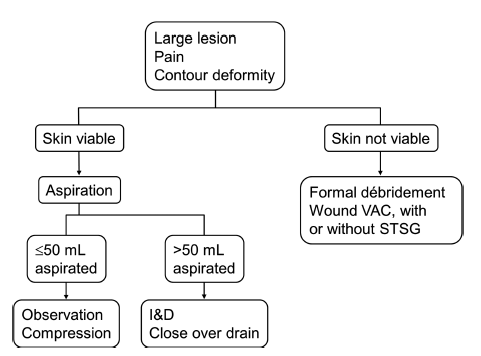
Their experience led them to develop the following practice guideline:

Bottom line: The Morel-Lavallee lesion can be challenging to treat. Although this study has limited numbers, it provides enough guidance to suggest a consistent way of managing it. I recommend adopting this algorithm to provide a standard pathway for dealing with it.

Reference: The Mayo Clinic experience with Morel-Lavallee lesions: establishment of a practice management guideline. J Trauma 76(2):493-497, 2014.

Do We Need All Those Trauma Centers In The US?

There are a lot of trauma centers in the US. Unfortunately, they are not very evenly distributed. An example of this disparity can be found in Washington state. Harborview Medical Center is the only Level I trauma center serving all of Washington, Alaska, Montana, and Idaho. Yet in other metropolitan areas, there can be multiple Level I’s, II’s, and III’s. And in some other areas, new centers seem to be popping up right and left.

Unfortunately, there is such a thing as too many trauma centers. Opening a new center is a zero sum game, however. No more trauma patients will miraculously appear. They will only get redistributed from other centers, decreasing the number of their trauma admissions. Until the next one opens and begins to take patients away from the last new one, as well. Frequently, the “need” for the new center is strictly an economic one for its parent organization, not an actual population need.

The American College of Surgeons Committee on Trauma (ACSCOT) released a position statement on this phenomenon early this year. They promote the following guidelines:

  • Designation responsibility falls to the governmental agency that oversees the regional trauma system. This body needs leadership and statutory authority to enforce reasonable guidelines on how many centers may exist.
  • Trauma professionals must advocate for their patients in educating the lead agency about what the needs really are. The interests of the patients must supersede the interests of the providers and their health care organizations.
  • The designation process should be guided by a concrete regional trauma plan.
  • Needs should be assessed using concrete measures like the number of centers per 100,000 people, population location with respect to these centers, EMS transport times, trauma mortality, and frequency of diversion status.
  • Trauma center allocation should be reassessed on a regular basis.
  • Regional variability must be taken into account.

Bottom line: A super-abundance of trauma centers already exists in several cities around the US (and you know who you are). Unfortunately, the cat is out of the bag, and few if any designating agencies have stepped up to the plate to deal with this. The sad truth is that little will happen until hastily and poorly resourced centers start to close unexpectedly, straining established trauma centers and jeopardizing patient safety. When this crisis finally hits, our state and regional trauma systems will finally seek and wield the authority to designate more intelligently.

Reference: Statement on trauma center designation based upon system need. ACSCOT January 2015.

Are We Wasting Valuable Helicopter EMS Resources?

The use of helicopters for transporting injured patients dates back to World War II. Thirty years later, this concept was translated into civilian practice. Today, there are hundreds of helicopter EMS (HEMS) services across the US, and thousands world-wide. Unfortunately, the indications for using this service are not strictly defined, and it is very expensive compared to ground EMS transport. In the US alone, there are over 400,000 HEMS transports per year. This creates the opportunity for use in patients who are not seriously injured, as well as the potential for wasted resources.

The University of Arizona at Tucson examined 6 years of transport data to their center, by both ground and air. They were interested to see if they could identify a group of HEMS-transported patients that could have safely and more reasonably been transported by ground ambulance. They defined this group of “minimally injured” as having an injury severity score (ISS) of 5 or less.

Here are the factoids:

  • A total of 5,202 patients were transported, 19% by air and 77% by ground
  • Overall, the hospital length of stay was significantly longer for HEMS patients (3 vs 2 days), as was ICU length of stay (2 vs 1 days) [Hmm..]
  • ISS was significantly higher in the HEMS group as well (9 vs 5) [Hmmmmm…]
  • There was [of course] no difference in mortality between the two groups
  • By their definition, 28% of HEMS patients were minimally injured, compared to 39% of ground transfers
  • The average charge for a HEMS transport was $18,000

Bottom line: This is another paper that just doesn’t deliver on what it’s title suggests. But this one is an underestimation of the result, not an overestimation, for once. From personal experience, I see lots of examples of patients who don’t need air transport but get it anyway. But if you dive more deeply into the data in this paper, you can see why it’s just not good enough. Sure, they’ve got a lot of patients. But if you look at the clinical reality of the numbers, none of the patients were really that sick. The maximum ISS in the HEMS group was 17! The GCS for every patient in the study was 14 or 15. The maximum hospital LOS was 7 days. And the clinical significance of a 3 day vs a 2 day hospital stay is negligible.

These were just not very sick patients. It looks to me like none of their patients needed HEMS transport, other than for extreme distance issues. The authors needed to set a better definition of minimally injured patients, and if they had, they would have found that most of their HEMS transfers could have been shifted to ground ambulance.

This paper really points out (more than the authors anticipated) the potential resources being wasted. There are already some suggested rules for optimal use of HEMS. But unfortunately, we tend to ignore them! It’s time to start a concerted effort to more wisely use this valuable and expensive resource.

Related posts:

Reference: Overuse of helicopter transport in the minimally injured: a health care system problem that should be corrected. J Trauma 78(3): 510-515, 2015.

A Cool Way To Look At Injury Data

Governmental agencies everywhere collect trauma related data. The US federal government maintains a number of databases, such as the Fatal Accident Reporting System (FARS), the Census of Fatal Occupational Injuries (CFOI) and many others. States collect similar but smaller datasets. Even towns and municipalities collate injury information in the form of prehospital run sheets.

But reams of data are of no use unless you can learn something from it. Unfortunately, most of this data is tucked away in database management systems, or in some cases just stacks of paper forms locked up somewhere. In order for humans to make sense of it and do useful things with it, we need to transform it into forms that we can easily interpret and make sense of.

Fortunately, there are lots of visual, electronic tools available to help us do just that. One of the most helpful tools is the programmable geographic information system (GIS). An example of this is Google Maps. Most of us have used this or a similar tool in some form, usually to get directions from here to there. But you may not be aware that Google provides a programming interface so a savvy user can place any type of geography-related data on the map, creating what is called a mashup.

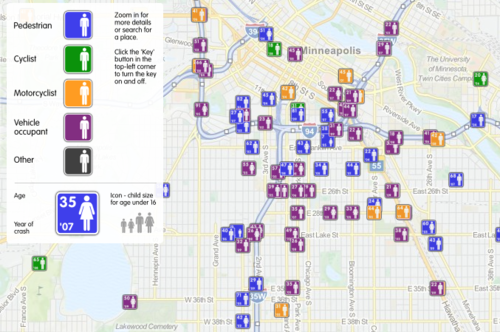
Imagine crossing the FARS database, which contains extensive data points on every fatal road accident in the US, with a mapping system. This would allow creation of a map showing where every person lost their life in a road accident, along with additional pertinent information about the event. A great example of this is demonstrated below. It was created by ITO World Ltd., based in the UK. They crossed fatality information with geographic map data in both the US and the UK.

This map shows fatal road events around Minneapolis from 2001 to 2009. The type of event (pedestrian struck, motor vehicle crash, etc.) is displayed along with age, year and sex. It is movable and zoomable so it can be viewed it in great detail. Click on the map above to open a new window to the full map.

Bottom line: Using trauma data / map mashups is a great way to visualize complex information. It also allows us to plan meaningful prevention activities based on local information (a requirement for ACS trauma center verification). Imagine looking over such a map of your city, and identifying a cluster of pedestrian fatalities. Then you notice that this cluster is 2 blocks away from an elementary school. This could prompt you to work with the school to implement automobile awareness programs for the children, have the city review signage and obstructions to view in the area, and optimize the number and placement of crossing guards. Then redo the map afterwards to judge the impact. Wow!

Website: http://map.itoworld.com/road-casualties-usa#fullscreen

Reference: Using geographic information systems in injury research. J Nurs Scholarsh 39(4):306-311, 2007.