Ever wonder what is going on when you drag your mouse across a CT image, or when you change the “window” settings of an image from lung to abdomen? It all has to do with the way CT generated xray information is displayed, and how your eyes and brain perceive it.
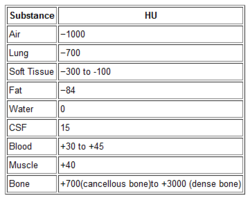
Let’s get down to basics. The first thing needed is to understand the concept of radiodensity. The CT scanner uses a set of software algorithms to determine the amount of x-radiation absorbed by every element in a plane of tissue. Each of these elements is represented by a pixel on the video display, and the density (amount of x-radiation absorbed) is measured in Hounsfield units. This scale was developed by Sir Godfrey Hounsfield, who set the radiodensity of water at 0, and air at -1000. The scale extends in the positive direction to about +4000, which represents very dense metals. See the table for the density of common substances on CT.

When you view a CT scan on a video display, two important numbers are displayed on screen. The first is the window width (W), which describes the range of Hounsfield units displayed. The maximum window width possible is usually about 2000, but our eyes are not capable of seeing this many shades. Actually, we can really only distinguish about 16 shades of gray. So the window width is divided by 16, and each group of Hounsfield values is converted to one of 16 shades of gray. The lowest Hounsfield numbers in the window range are shown as black, and the highest are white.
The second important number is the window level (L). This is the Hounsfield number in the center of the window width. So let’s look at some typical examples of W/L settings.
The abdomen contains mostly soft tissue, which is just a little denser than water. So most of the abdominal contents have Hounsfield values from 0 to 100 or so. A typical abdominal scan W/L setting is 350/50. This means that a total range of 350 different densities are displayed, centered on a density of 50 Hounsfield units ( range is -125 to 225 HU). Each difference of 22 HU will show up as a different shade of gray. So this narrow window allows us to distinguish relatively subtle differences in density.
The chest cavities are primarily air-filled, and the lungs are very low density. So it makes sense that a typical lung W/L setting is 1500/-500. The window ranges from -1250 to +250 HU, and a wider range of 94 HU represents one shade of gray. This is typical of body regions with a wider range of densities.
Finally, bone windows are usually 2000/250. This window is centered above the usual tissue densities, and is very wide so that it shows a wide range of densities in only 16 shades of gray. Thus, the contrast appears very low.
On most displays, the window width increases as you drag the mouse to the right. This increases the range of densities in a shade of gray, thus decreasing the overall amount of contrast in the image. Dragging the mouse down decreases the window level, moving it toward the air end of the spectrum. This allows you to center your window on the type of tissue you are interested in viewing and adjust your ability to distinguish objects with a lot or only a little contrast (see table above).
I apologize to my radiology colleagues in advance for this simplistic explanation. Trauma professionals have minimal exposure (pun intended) to the physics and details of radiographic imaging. We are much more interested in effectively using this technology to save our patients’ lives.

