Category Archives: Trauma Center

Impact Of A Trauma Nurse Practitioner Model On Nonsurgical Admissions

Nonsurgical admissions are a concern for most verified/designated trauma centers. Under the current 2014 Resources for Optimal Care of the Injured Patient, all trauma patient admissions to a nonsurgical service must be concurrently reviewed by the trauma program. This process guards against trauma patients sneaking into the hospital on medicine services where the quality of the care for their injuries may not be monitored.

Typically, this requirement is met by having the trauma program manager (TPM), trauma PI coordinator (TPIC), or registrar run a daily admission report and mark patients with a potential trauma diagnosis for further review. Some clinician then reviews the patient in person or via a chart check. No further attention is needed if the patient has low acuity injuries or has been seen by the trauma or other surgical service. If not, additional scrutiny is recommended to identify patients who might be better off with a trauma service consult or even a transfer of service.

The trauma group at the Charleston Area Medical Center in West Virginia postulated that adopting a trauma nurse practitioner (TNP) model to provide care for patients otherwise admitted to a hospitalist service would improve care and decrease nonsurgical admissions. The nurses were supervised directly by the trauma attending surgeons.

They analyzed retrospective registry data during a 22-month period and compared nonsurgical admission rates with the same data for the preceding three years. Several performance metrics were evaluated, including length of stay and those statistics hospitals love to watch, discharge orders placed by noon, discharge location, and time to operating room.

Here are the factoids:

  • A total of 749 patients were admitted to the TNP service and 651 to hospitalist services
  • Patients in the TNP group were significantly younger (59 vs. 76) and more likely to be male
  • ISS was the same, but the TNP service patients had slightly more injuries (1.6 vs. 1.2) overall, and their patients were more likely to require an operation
  • The number of comorbidities was higher on the hospitalist service (2 vs. 1.6)
  • Hospital length of stay was one day shorter in the TNP group, which  was significant
  • TNP service patients were more likely to discharge home rather than to a skilled nursing facility
  • Time to OR for the TNP patients was significantly shorter by 11 hours
  • 30-day readmission rates were the same
  • The percentage of patients admitted to a nonsurgical service decreased from 20% to 14% after implementation

The authors concluded that the nonsurgical admission rate declined significantly, and several performance metrics also improved. In addition, the decreased length of stay was projected to result in a decrease of over $876,000 in hospital charges throughout the study.

Bottom line: This study illustrates some potential differences that surface when patients are admitted and managed by a trauma service rather than a hospitalist service. I say potential because there are a lot of confounders here.

The patients on the two services were very different. Although the TNP service patients had slightly more injuries (1.6 vs. 1.2), their ISS was identical. They also had fewer comorbidities. There appears to be some selection process in play here, but it was not explicitly stated in the paper. It also appears that older and more complicated patients, in terms of their comorbidities, were admitted to the hospitalists. Those with injuries more likely to require surgery were admitted to the TNP service.

Nonsurgical admission rates definitely decreased, but without knowing the selection criteria, this could have been due to just the presence of the TNP service and the desire to admit patients to it. The decreased hospital LOS and higher discharge rate to home are impressive, but could this also be due to these patients’ younger age?

The final issue is that the rules have changed! Starting later this year with the implementation of the 2022 Resource Document, the 10% nonsurgical admission rate threshold will disappear. Now, all nonsurgical trauma admissions must undergo primary review via the PI process. If any issues are identified, the ISS is greater than 9, or there was no trauma or surgical consultation, they must be escalated to a timely secondary review by the trauma medical director. Gone are the days of retrospective reviews of these cases!

What to do? It’s a balancing act in terms of trauma service capacity and staffing. Ideally, most injured patients are best served on the trauma or surgical specialty service. Several papers have outlined improved outcome metrics with this arrangement. Utilizing TNPs or physician assistants to capture and manage appropriate patients can definitely be helpful. 

An alternative is to integrate a hospitalist, preferably with geriatric expertise, into the trauma service so injured patients with more complex medical issues can be comfortably managed on the trauma service.

Reference: Rate of Nonsurgical Admissions at a Level 1 Trauma Center: Impact of a Trauma Nurse Practitioner Model. J Trauma Nurs 27(3):163-169, 2020.


Print Friendly, PDF & Email

Nonsurgical Admissions And The Nelson Score

All trauma centers admit some of their patients to nonsurgical services. This usually occurs when patients have medical comorbidities that overshadow their injuries. Unfortunately, the decision-making that goes into balancing the medical versus trauma issues is not always straightforward. The fear is that if trauma patients are inappropriately placed on a nonsurgical service, mortality and morbidity may be higher because their injuries may not receive adequate attention.

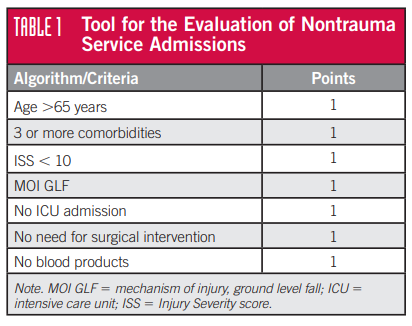
To take some of the variability out of the decision-making process for admitting service, two surgical groups on Long Island created a scoring system that incorporated several parameters described in the ACS Optimal Resource Document (Orange book). Some additional parameters were also included that the authors believed were relevant to the choice of admitting service. Here’s the final list:

The first author on the paper was a nurse, Laura Nelson, and hence this has come to be known as the Nelson Score. Patients with a score score of 7 were considered definitely appropriate for nonsurgical admission. Scores of 4 or 5 were subject to more in-depth review, and those with a score of 3 or less were considered definitely appropriate for trauma service admission. There is no mention of what to do with a score of 6 in the original paper, but I presume it should be almost a slam dunk for considering nonsurgical admission.

The authors evaluated this system’s utility over a two year period. They found that using it placed more patients on the trauma service (nonsurgical admissions decreased from a peak of 28% to somewhere around 10%). They also examined morbidity and mortality statistics between the two types of admissions, and found no significant differences.

The concept was further tested by the trauma group at UCHealth in Colorado Springs. They performed a retrospective review of four years of data that included over 2,000 patients. Patients were older (mean 79 years) and nearly all had blunt mechanism. Mean ISS was 9 and the nonsurgical admission rate was 19%. Patients with a Nelson score of 6 or 7 were even older and had more comorbidities.

Regression analysis did not identify admitting service as a predictor of mortality. The authors concluded that using this score is a safe way to objectively identify patients who would benefit from nonsurgical admission.

Bottom line: I have visited a number of hospitals that successfully use the Nelson score to assist with admission service decision-making while the patient is still in the emergency department. The only gray zone is the score of 4 or 5. Each program will need to determine their own cut point so they can make the service decision more objectively.

Trauma programs can also use this tool to expedite PI review of patients who have already been admitted to a nonsurgical service to check appropriateness. If the score is less than 6 further scrutiny is needed to determine if a consult from or transfer to trauma should be recommended.

References:

  1. Nonsurgical Admissions With Traumatic Injury: Medical Patients Are Trauma Patients Too. Journal of Trauma Nursing, 25 (3), 192-195, 2018.
  2. Evaluation of the Nelson criteria as an indicator for nonsurgical admission in trauma patients. Am Surg, 88(7), 1537-1540, 2022.
Print Friendly, PDF & Email

Best of AAST 2022 #8: Financial Vulnerability Of Trauma Centers

Here’s another abstract on trauma center / system finance. Trauma centers are part of the safety net in the healthcare systems of many countries. The way they are funded varies tremendously. In the US, health insurance pays most of the bill for patient care. Unfortunately, not all patients are covered, so there is financial risk to the center based on how many underpaying patients present for care.

The group at Scripps Mercy in San Diego performed a financial health analysis of all ACS-verified trauma centers in the US. They applied a Financial Vulnerability Score metric (FVS), although I could not locate anything on this via an internet search. They analyzed the RAND Hospital Financial Database, which is based on information obtained from the CMS Healthcare Cost Report Information System. Using this data they calculated the FVS for each center. They sub-grouped the hospitals into high, medium, and low vulnerability and compared them.

Here are the factoids:

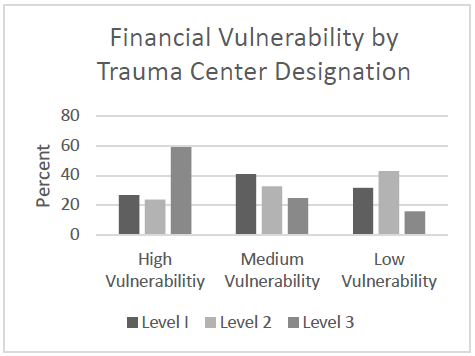
  • A total of 617 trauma centers were identified and analyzed: 194 Level I, 278 Level II, and 145 Level III
  • Level III trauma centers made up 59% of the high financial risk centers
  • The majority of Level I and II centers were in the middle or low risk categories
  • Characteristics of high risk centers were lower number of beds, negative operating margin, and less cash on hand
  • Low risk centers had greater asset to liability ratios, lower outpatient shares, and 3x less uncompensated care
  • The largest proportion of HFR hospitals were in New England and East North Central regions
  • Non-teaching centers had significantly higher financial risk than teaching hospitals (46% vs 29%)

The authors concluded that about 25% of Level I and II trauma centers are at high financial risk and that factors such as payor mix and outpatient status should be targeted to reduce this risk.

Bottom line: This is a fascinating abstract but leaves a lot to the imagination. The databases used have not been used in previous papers, and the information contained in them is proprietary. The FVS is also new and I have not been able to obtain any details.

Nevertheless, if the data and analysis are sound it may provide some new information to trauma centers and perhaps some insight on what factors to address to lessen their financial vulnerability. This is a lot of ifs. Hopefully the authors will enlighten us during the presentation so we can appreciate the real world value of the analysis.

Here are my questions and comments for the authors/presenter:

  • Please explain both the dataset used and the new FVS metric. Most readers and listeners are unfamiliar. We need to see how the data and analysis apply to trauma center financials and how the FVS has been validated.
  • How can the vulnerability factors be addressed? Payor mix is based on patient coverage and their socioeconomic status. It would seem to be difficult to manipulate by the trauma center. Outpatient vs inpatient status is also difficult to change and not fall afoul of CMS rules. What were other factors that were identified that could help centers reduce their financial vulnerability?

This could be an interesting abstract, but there was not enough room in the abstract to reveal all the details. Hopefully all will become obvious during the presentation.

Reference: FINANCIAL VULNERABILITY OF TRAUMA CENTERS: A NATIONAL ANALYSIS, Plenary paper #41, AAST 2022.

Print Friendly, PDF & Email

Best of AAST 2022 #2: How Much Does It Cost To Be A Trauma Center?

Becoming and remaining a trauma center is an expensive proposition. Some components can pay for themselves (surgical specialists and operating rooms) but others are required yet generate no revenue. These costs must somehow be offset for a trauma center to remain viable.

How much does it actually cost? There have been two papers that deal with this topic (see references). One was published way back in 2004 and examined readiness costs averaged across 10 Florida trauma centers. They comingled data for these hospitals, which were a mix of adult, pediatric, Level I and Level II centers. They arrived at a median annual cost of readiness of $2.1 million.

A similar study was published in 2017 for Level I and Level II centers in Georgia. They were ultimately able to estimate that the annual average readiness cost for Level I centers was $6.8 million, and for Level II centers was $2.3 million.

That’s a lot of money! These hospitals tend to be larger and have specialty centers that allow them to generate enough revenue to support the non-revenue parts of the trauma program.

But what about Level III and Level IV centers? They are generally much smaller hospitals. In many more rural states they are critical access hospitals with 25 or fewer beds. They don’t have a wealth of other programs that can generate significant excess revenue.

So how much does it cost them?  A group at Mercer University in Atlanta attempted to quantify this issue. They developed a survey tool along the lines of the previous work. They sent this to all 14 Level III and Level IV trauma centers in the state, who based their numbers on 2019 data.

Here are the factoids:

  • For Level III centers, the average annual readiness cost was $1.7 million
  • The most expensive components for Level III centers were for clinical medical staff. This was most likely related to stipends for service / call coverage.
  • For Level IV centers, the cost was only $82 thousand and primarily involved administrative costs (most likely trauma program personnel)
  • Education and outreach programs are mandated for these centers but the centers actually spent only $8,000 annually. The authors believe this represented significant under-resourcing by the hospitals.

The authors concluded that there is a need for additional trauma center funding to enable Level III and IV centers to meet the requirements set forth by the American College of Surgeons.

My comments: This is a very enlightening paper on the cost of being a trauma center. Only two papers have previously explored this, and only for higher level centers. However, the devil is in the details. The nuts and bolts numbers and the assumptions made on how they fit together are key. But it does provide some enlightening information on what it costs to be a trauma center. And the disparity between the two levels is fascinating / frightening.

Here are my questions for the authors / presenters:

  • What assumptions did you have to make to arrive at these numbers? Please explain the details of your model and where you think the weaknesses in it may lie.
  • Why is it so much more expensive to be a Level III center? The abstract places the blame on “clinical medical staff.” Are these on-call stipends or something else?
  • What would you tell wannabe Level III or IV centers looking to become a trauma center? Unfortunately, these numbers might scare some of the off.

Thanks for an intriguing and challenging paper! The discussion will be very interesting!

References: 

  1. ASSESSING TRAUMA READINESS COSTS IN LEVEL III AND LEVEL IV TRAUMA CENTERS. Plenary session paper #10, AAST 2022.
  2. The cost of trauma center readiness. Am J Surg 187(1):7-13, 2004.
  3. What Are the Costs of Trauma Center Readiness? Defining and Standardizing Readiness Costs for Trauma Centers Statewide. Am Surg 83(9):979-990, 2017.


Print Friendly, PDF & Email

What GCS Should Trigger Trauma Activation?

For the most part, trauma centers are free to pick and choose their own trauma team activation trigger criteria. Typically, these are a mix of physiologic, anatomic, and mechanistic items. However, the American College of Surgeons Committee on Trauma mandates that either seven (Orange Book) or eight (Gray Book) specific criteria must present in every center’s highest-level activation list.

One of these mandatory criteria is a Glasgow Coma Scale (GCS) score of eight or less. The reason is that this level denotes a severe brain injury and as patients approach it they are less and less able to protect their own airway. Although this specific GCS is a minimum, centers are free to choose their own specific threshold as long as it is not any lower.

How does a center choose the “right” GCS? It seems straightforward, right? A mild TBI is defined as GCS from 13-15. These patients have only lost one or two points in their eye-opening, verbal, and motor scores and are relatively unlikely to have a significant lesion in their head or an airway issue.

At the other end of the spectrum is the severe TBI, with a GCS of 3-8. These are a chip shot, with the potential for severe injury and a frequently threatened airway. They demand rapid assessment and intervention, hence the required trauma activation.

But what about those patients with moderate TBI with a GCS from 9-12? They obviously have a higher risk for serious intracranial injury. And as the GCS declines, the patient’s ability to protect their airway decreases. At some point between those GCS scores, most clinicians hit their own internal trigger to provide a definitive airway.

So what do actual trauma centers choose as their threshold? I conducted an informal survey of my readers, asking them to provide their specific GCS threshold.

Here are the factoids:

  • A total of 147 trauma centers of all levels responded
  • They were located in the United States, Germany, Saudi Arabia, and Singapore
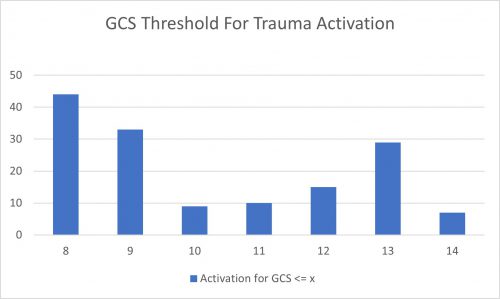
  • This chart shows the number of centers that selected a threshold less than or equal to the GCS on the horizontal axis:


  • Nearly a third of centers (30%) adhere strictly to the ACS criterion of 8
  • Another 22% use a threshold of 9, possibly to avoid any confusion from having a “less than or equal to” criterion
  • There is another bump on the curve at 13, with 20% using this threshold

Bottom line: A little more than half of centers use a GCS threshold of 8 or 9 as their TTA trigger. This meets the ACS criteria, but could potentially leave a few airways unprotected from time to time. Only about 5% of centers use the higher GCS levels with the exception of GCS 13. That seems to be another popular one.

Which one is right for you? GCS 8 will always work because it is the minimum requirement. My own personal threshold trends higher. I would rather be called to an activation and apply my own judgement rather than come running only when the patient needs to be intubated followed by a trip to the OR for craniotomy.

You will need to work with your emergency physicians, trauma surgeons, and neurosurgeons to determine their collective comfort levels. It comes down to a balance between safety and unnecessary intubation. Look at your own center’s experience and pick a threshold that achieves a proper balance of overall patient safety.

Print Friendly, PDF & Email